Talks · S Anand
Archive · 28 Feb 2015
1996 TEDx NMIMS Bangalore · 28 February 2015 · 13 minutes

The Strangest Row

In 1996, one Tamil Nadu constituency gave its voters a ballot so long that it had to be bound as a booklet. In a 13-minute talk, Anand followed Indian election data from messy PDFs to a newsroom touchscreen, and finally to that impossible number. What looked like broken data turned out to be people trying to be heard.

Listen to the talk

A time capsule. The talk describes analyses from the 2013 Karnataka and 2014 Lok Sabha elections. Its figures are as of then. Figures from later reporting are dated where they appear.

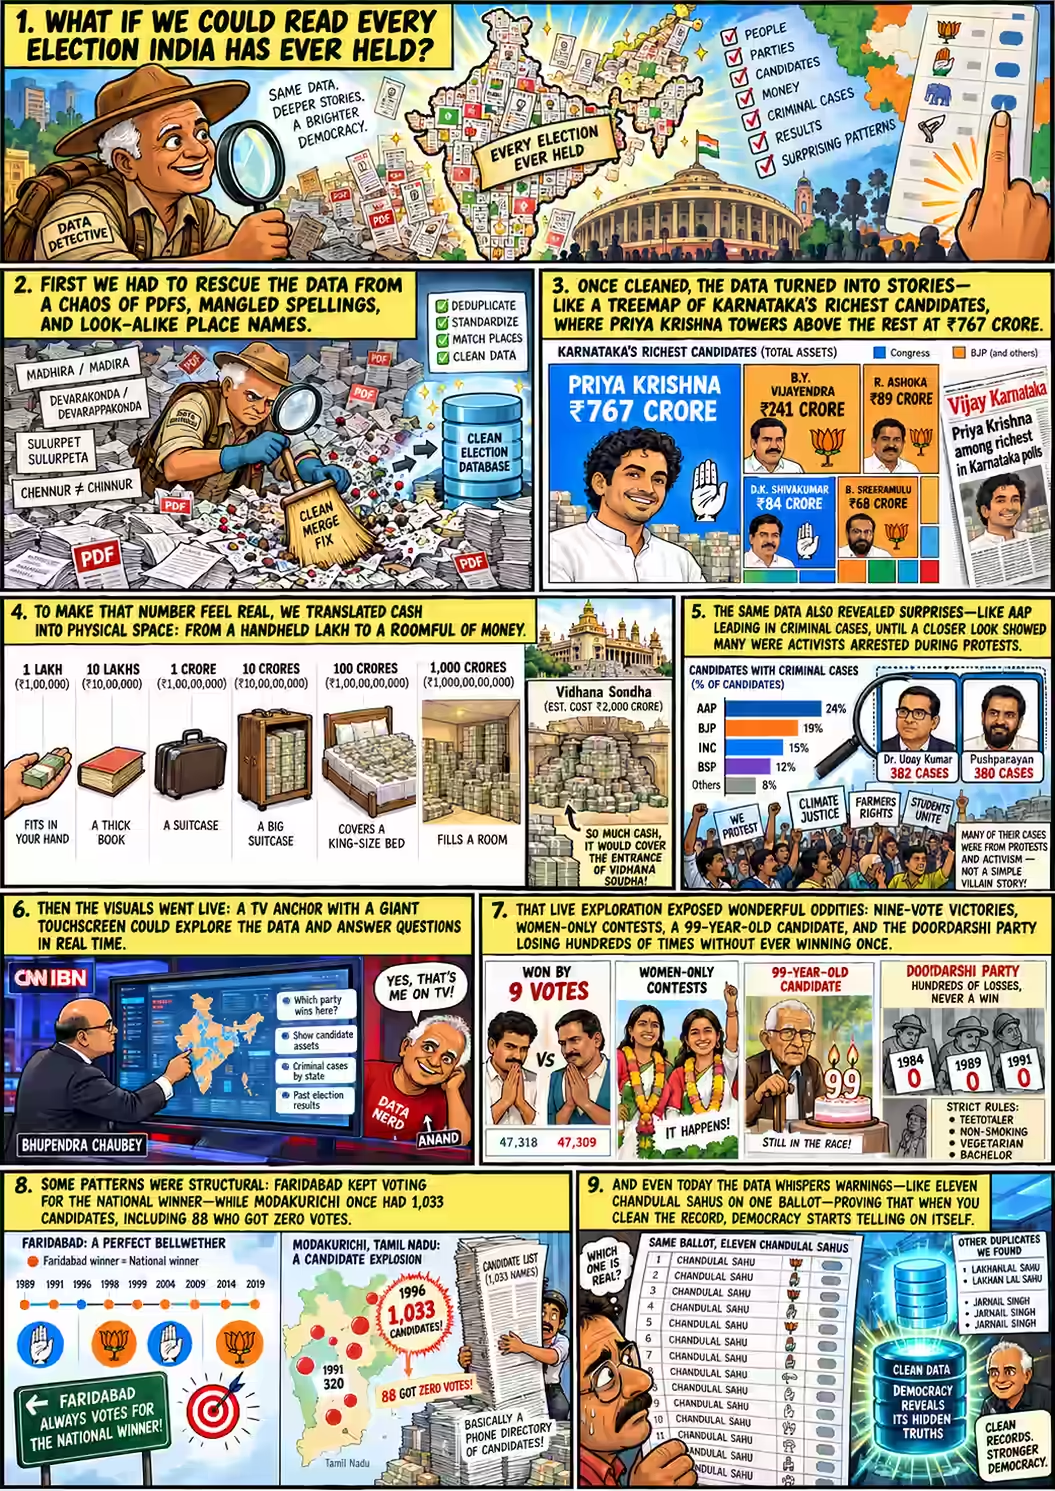
Nine-panel comic retelling the talk: a data detective with a magnifying glass over a map of India; a broom sweeping mangled place names out of PDFs; a treemap with Priya Krishna at ₹767 crore; cash growing from a handful to a roomful beside the Vidhana Soudha; AAP topping a criminal-cases chart beside protest placards; a TV anchor at a giant touchscreen with Anand waving behind; panels on a nine-vote win, a women-only contest, a 99-year-old candidate and the Doordarshi party's zeros; Faridabad as a bellwether and Modakurichi's 1,033 candidates; and a ballot with eleven Chandulal Sahus.
The talk as a comic page. It's an illustration, not a record. The artist made up several of its numbers, such as the party percentages, other candidates' crores, the vote counts and a 2019 Faridabad result. The story below sticks to the talk and its sources.
01 Modakurichi, Tamil Nadu · June 1996

A ballot you had to read

On 2 June 1996, a month after the rest of Tamil Nadu had voted, people in Modakurichi near Erode walked into their polling booths and were handed a book instead of a ballot paper. Barrels stood in for ballot boxes. The supply of election symbols ran so short that some candidates got “one pen”, “two pens” and “three pens”.TNIE 2026

The DMK candidate who won says her party's Rising Sun was on page 25.

How many names do you think were in that booklet?

Perambalur, 1967as said on stage 10:01
~10
Madurantakam, 1984name as heard 10:36
90
Pallipattu & Aravakurichi, 1991as said 10:49
~250
Modakurichi, 1996Election Commission 11:05
1,033

Tamil Nadu Assembly constituencies, the way Anand walked through them on his animated map. Only 1,033 is confirmed by the Election Commission's FAQ, which also calls that ballot a “booklet”. The other three are as said in the talk and haven't been checked against the returns. Anand first said Perambalur had 18 candidates and then corrected himself to 10.

One seat, a thousand and thirty-three candidates. It's still the record. You'd expect a number like that to be a typo, a parsing bug or a duplicated table. It's real, though, and the reason for it is better than any error.

Anand didn't open with it. In February 2015 he saved it for the last two minutes of his TEDx talk and took the long way there: hundreds of PDFs, a pile of imaginary banknotes, a newsroom touchscreen and a party that never won. This story takes the same road. The talk plays beside the story, and tapping any 00:05 time plays that moment.

02 The obstacle

Every election, ever

“What would we get if we had the results of every single election that we've ever had in India? … What would we learn about our democracy in action?”

— Anand, opening the talk 00:05

The first answer was paperwork. The Election Commission publishes its results, but as PDFs, and Anand's team at Gramener had hundreds of them to turn into a single table. “Firstly, the data is not particularly easy to get,” he said 00:16.
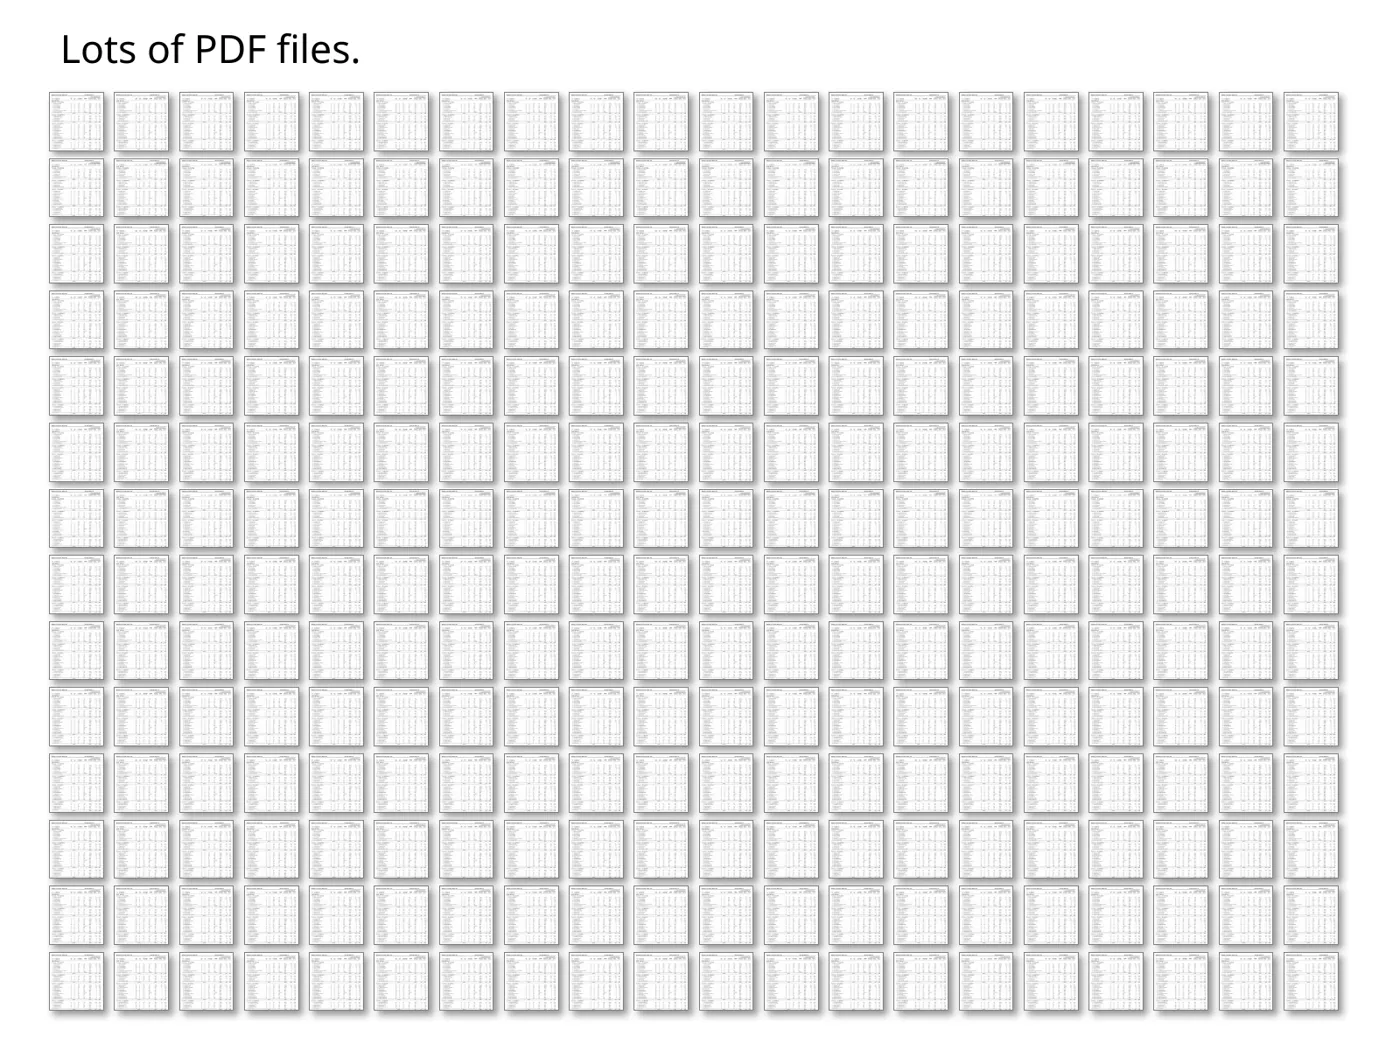
Slide titled “Lots of PDF files”, showing a grid of dozens of identical PDF page icons.
“Lots of PDF files.” A slide from the talk.
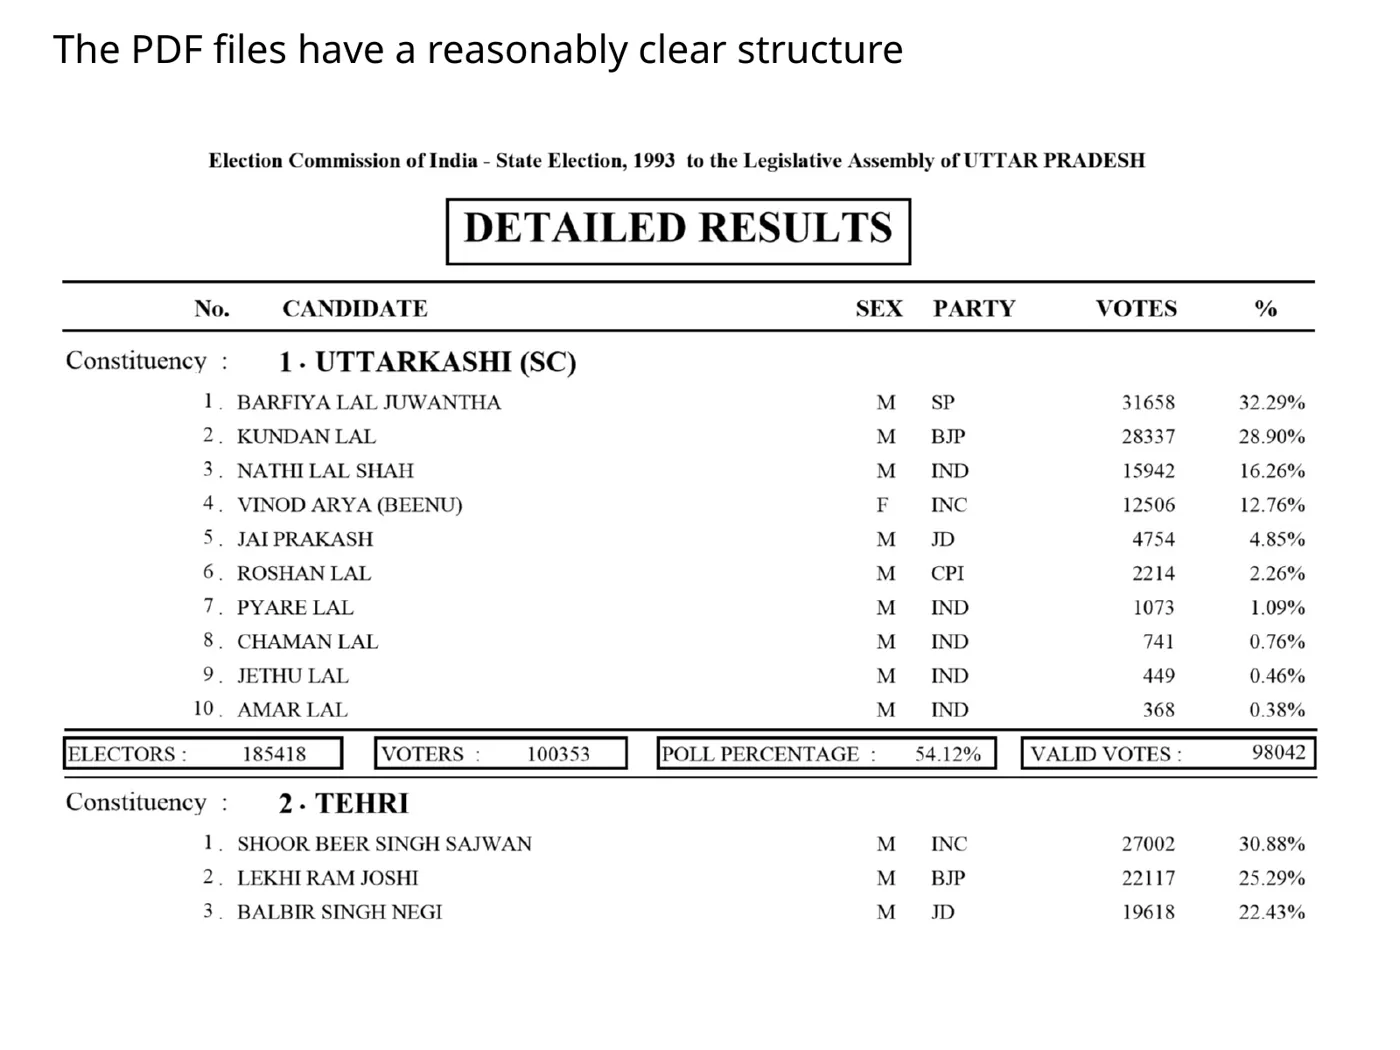
Slide showing a scanned Election Commission “Detailed Results” page listing candidates, sex, party, votes and percentage for each constituency.
Each PDF has a fairly clear structure, so it can be parsed.

Parsing gave them structure, but not consistency. The same constituency could be spelled several different ways from one election to the next. To count anything across years, you have to decide which names are the same place. Try it with the actual clusters Anand's team faced.

Same place, or different places?

Each row is a group of constituency spellings from the cleaning slide, with how many result rows used each spelling.

1
MADHIRA 52MADIRA 9

2
DEVERKONDA 56DEVARAKONDA 7DEVARKONDA 5

3
SULURPET 38SULLURPET 9SULLURPETA 9

4
CHINNUR 63CHENNUR 56

“It's hard to figure out if, when you say Chennur, it is the same as Chinnur or it's a completely different district. And it turns out that they are completely different.”
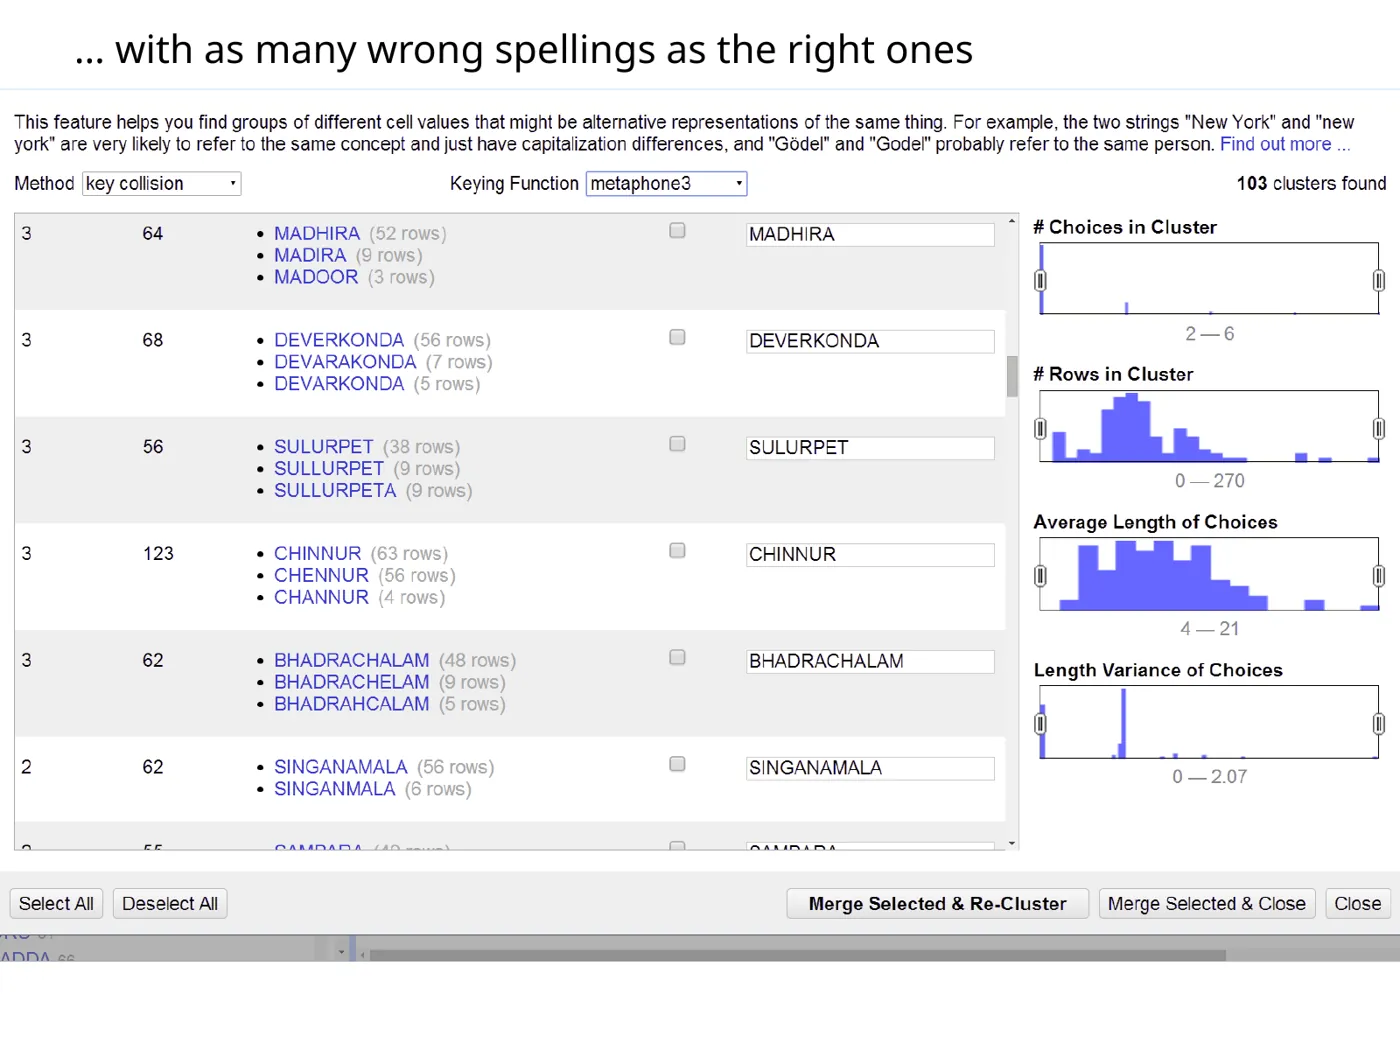
Screenshot of a data-cleaning tool's cluster dialog using key collision with the metaphone3 keying function. It reports 103 clusters, including Madhira/Madira/Madoor, Deverkonda/Devarakonda/Devarkonda, Sulurpet/Sullurpet/Sullurpeta, Chinnur/Chennur/Channur, Bhadrachalam variants and Singanamala variants.
The cleaning slide, “with as many wrong spellings as the right ones”. The clustering tool matches names by how they sound (metaphone3) and found 103 clusters. It proposed Chinnur, Chennur and Channur as one cluster of 123 rows, which is exactly the merge a person had to refuse. The Madoor and Channur variants aren't discussed in the talk.

That's the point of the slide. A cleaning step can be wrong with more confidence than any typo. A misspelling is obvious to anyone reading. A wrong merge is invisible. It blends two places' histories into one tidy row that every later chart trusts. “After a fair bit of work,” Anand said 00:53, they cleaned this and several other datasets, “and said, let's see what we find.”

Context check · countsOn stage Anand said the variants turned up “53 times in one way, 40 times in another”. The counts on the slide are different (Madhira 52 and Madira 9, for example). The spoken numbers were an illustration, and the slide is the record.
03 Karnataka · 2013

How much is ₹767 crore?

Once the data was clean, people started asking it questions. Ahead of the 2013 Karnataka Assembly election, the question was the obvious one: who are the richest? Gramener's answer ran in the Kannada daily Vijay Karnataka as a treemap.
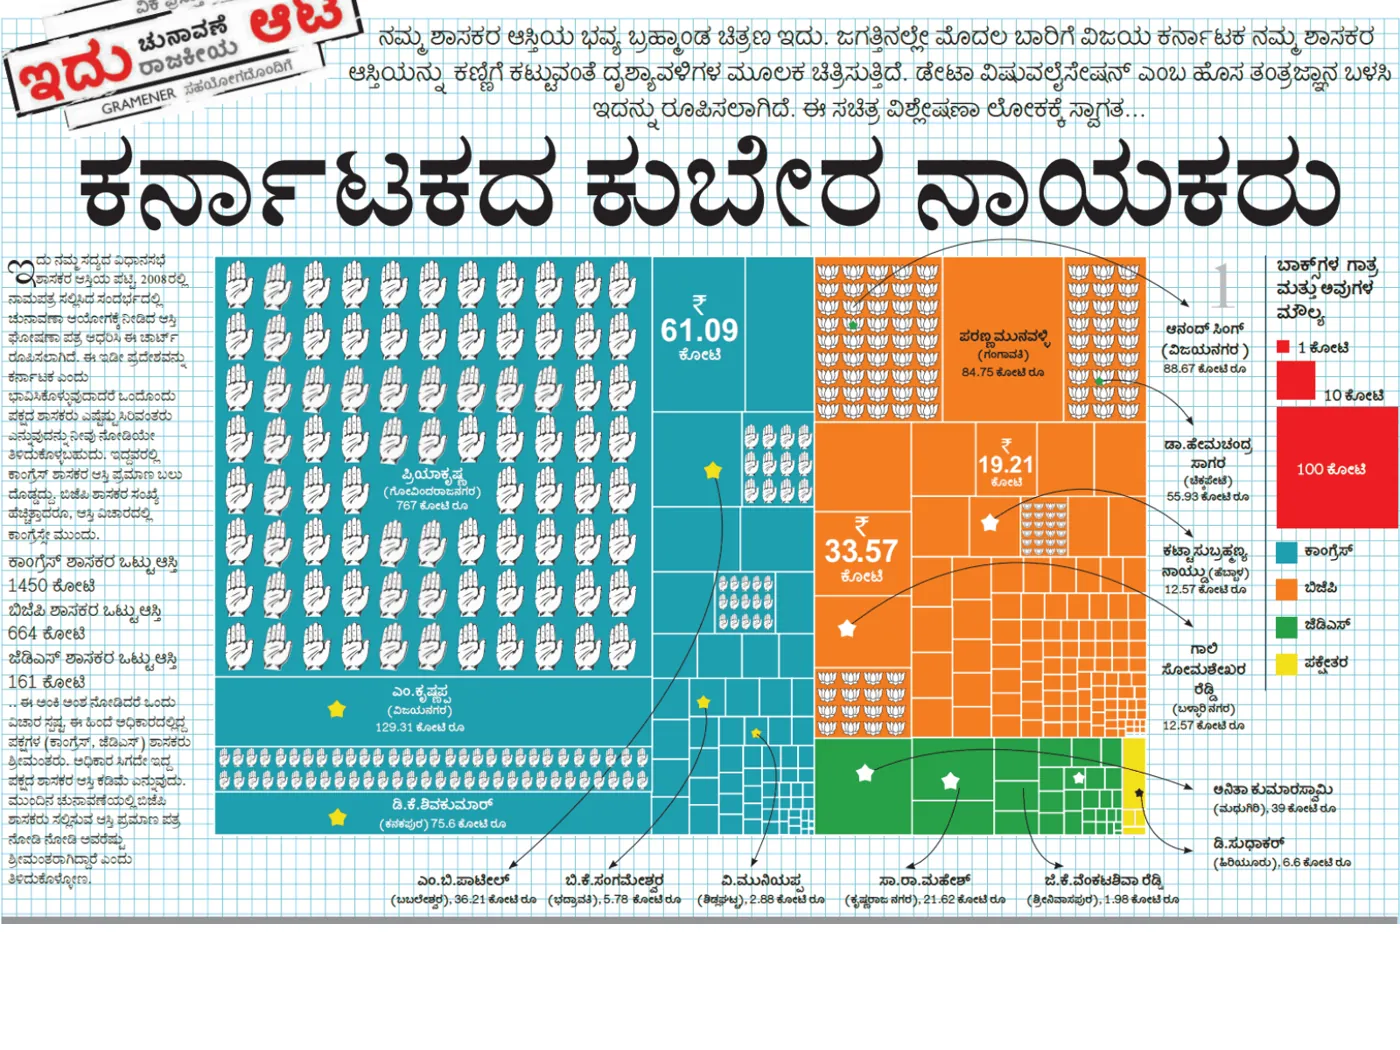
Kannada newspaper page titled ಕರ್ನಾಟಕದ ಕುಬೇರ ನಾಯಕರು. A treemap fills the page: a large blue Congress region on the left is dominated by one box covered in hand symbols, labelled ಪ್ರಿಯಾಕೃಷ್ಣ (ಗೋವಿಂದರಾಜನಗರ) 767 ಕೋಟಿ ರೂ; orange BJP boxes with lotus symbols and green JD(S) boxes fill the right. A legend sizes squares at 1, 10 and 100 crore.
“ಕರ್ನಾಟಕದ ಕುಬೇರ ನಾಯಕರು” (roughly “Karnataka's Kubera leaders”, after the god of wealth), from Vijay Karnataka with Gramener. Each box is one person's declared assets, in blue for Congress, orange for BJP and green for JD(S). The box covered in hand symbols at top left is Priya Krishna of Govindarajanagar, at 767 ಕೋಟಿ (₹767 crore).

“You'll notice one huge box out here. Right? So that's effectively one candidate whose wealth is more than pretty much all of the BJP put together.”

Context check · which ₹767 crore?The graphic's own Kannada caption gives the answer. It charts the assets of the sitting MLAs as declared in their 2008 nomination papers, not the 2013 candidates. On those figures the comparison holds: the caption totals Congress MLAs at ₹1,450 crore and BJP MLAs at ₹664 crore. Priya Krishna entered the Assembly through a 2009 by-election. His affidavit then declared ₹766.7 crore in movable assets (₹770.6 crore in total), and his 2013 affidavit declared ₹911 crore.MyNeta 2013 Both affidavits also list liabilities of ₹734 crore (2009) and ₹778 crore (2013). These are gross declared assets, mostly not cash, and much less once the debts are subtracted. Contemporary coverage: NDTV, Apr 2013.

Then the paper asked what every editor asks about a big number: what does it look like?

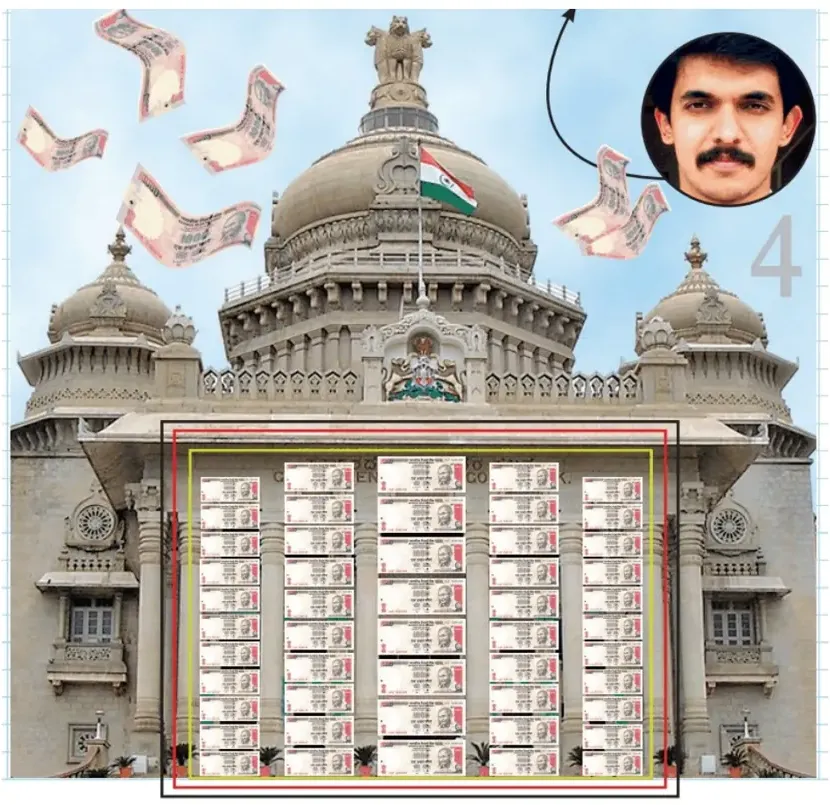
“How much is 767 crores? … ‘You know, will it fill the entire Vidhana Soudha if I took it out as cash and placed it on the floor?’”

— Anand, on the newspaper's brief 01:39
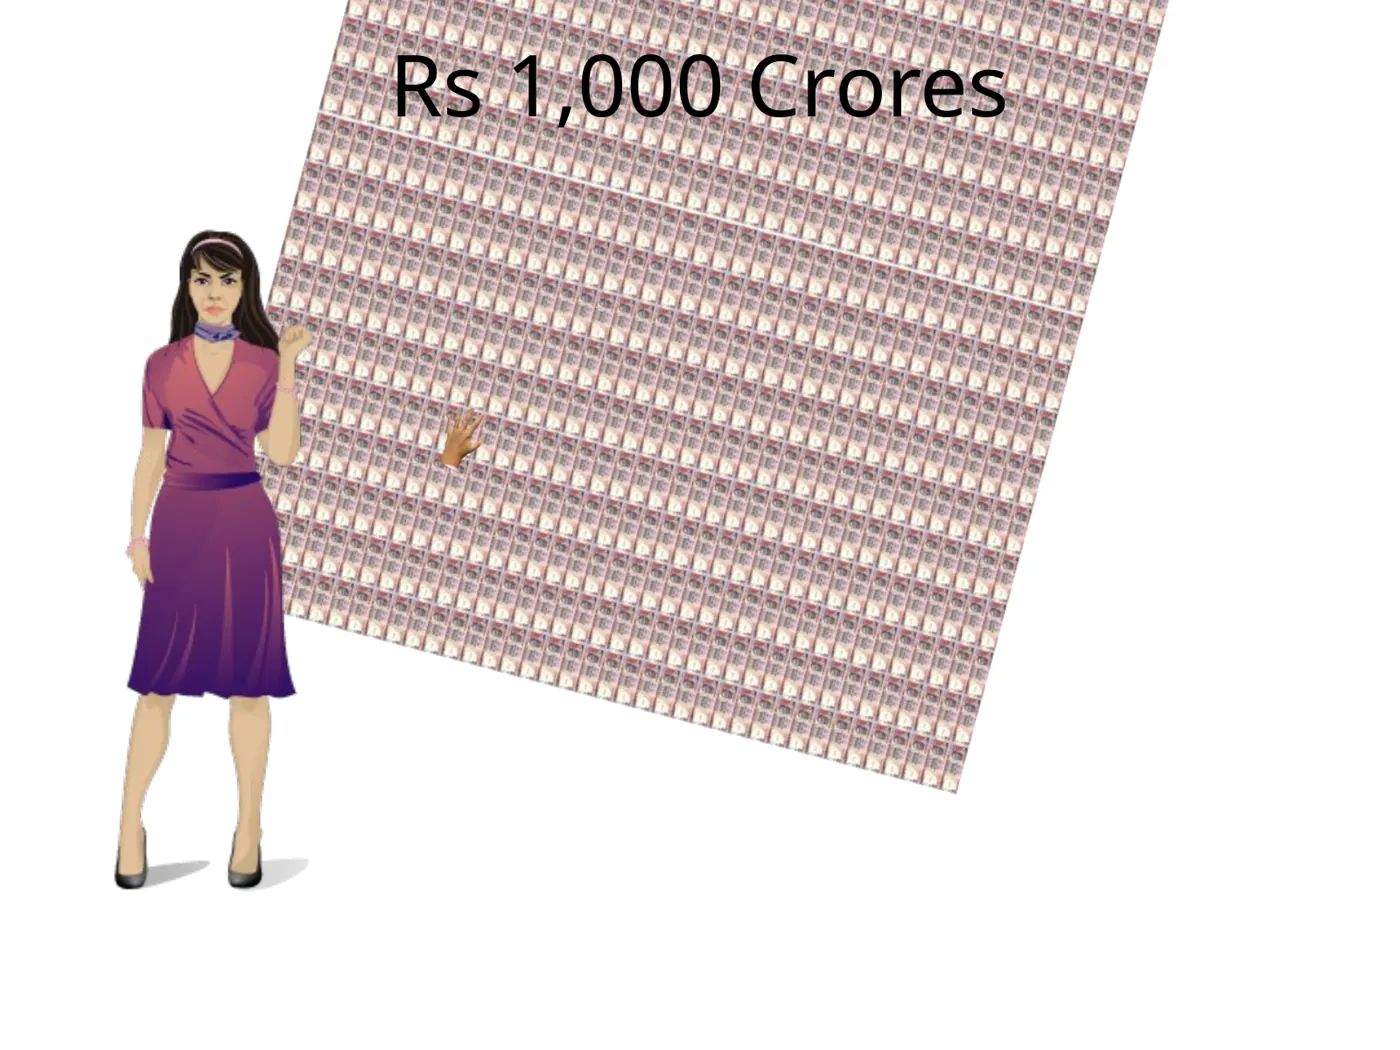
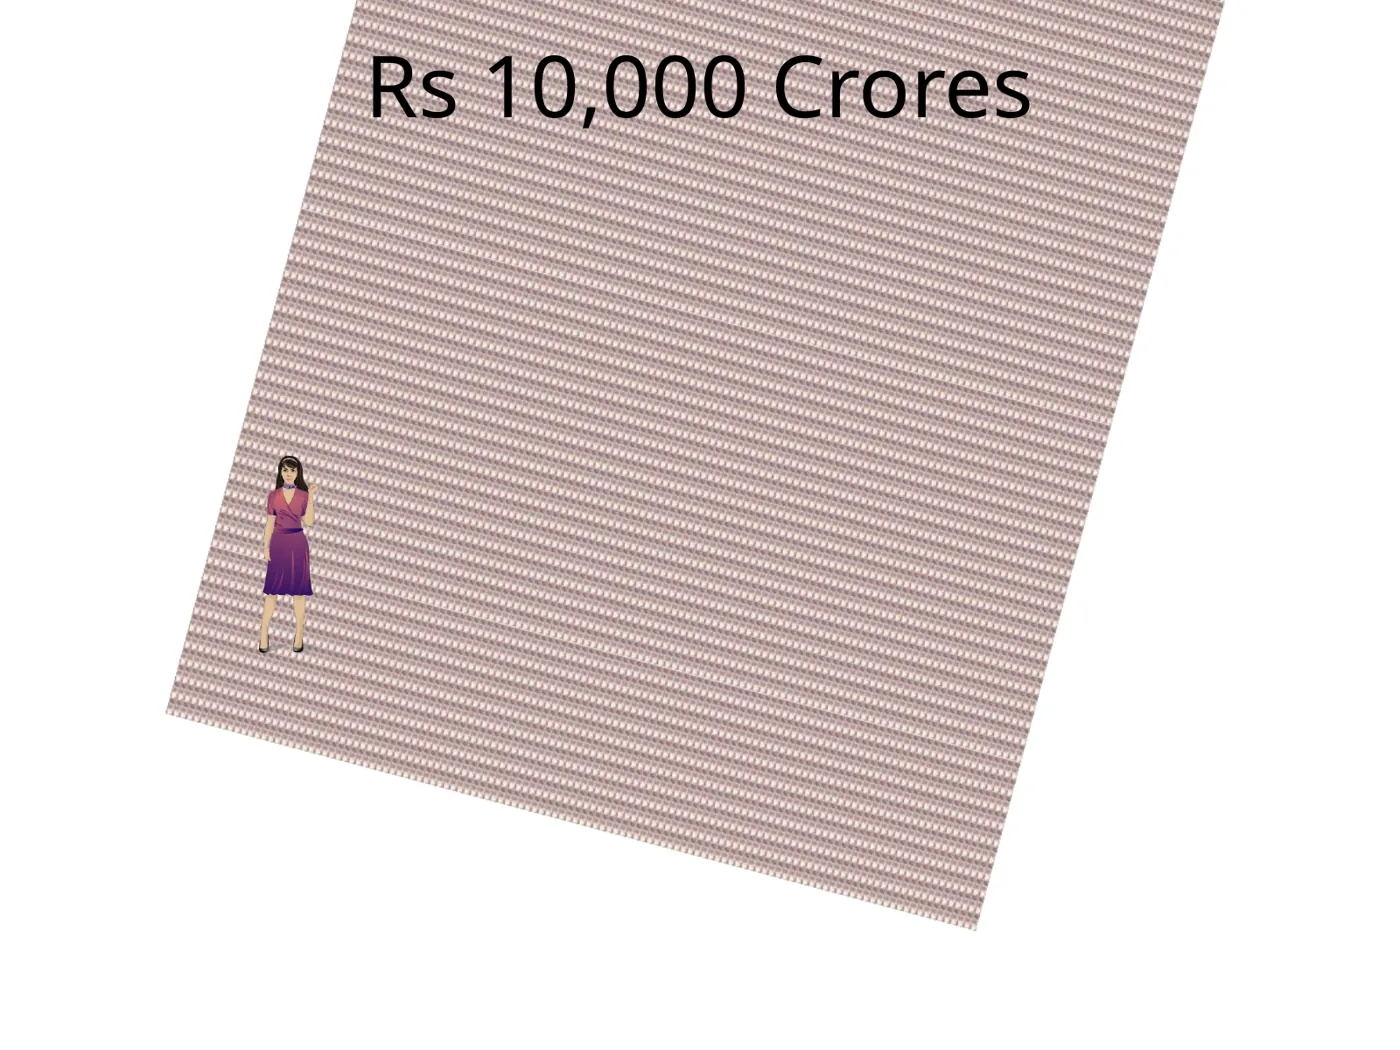
The cash ladder · the talk's own slides

Climb from a handful to a building
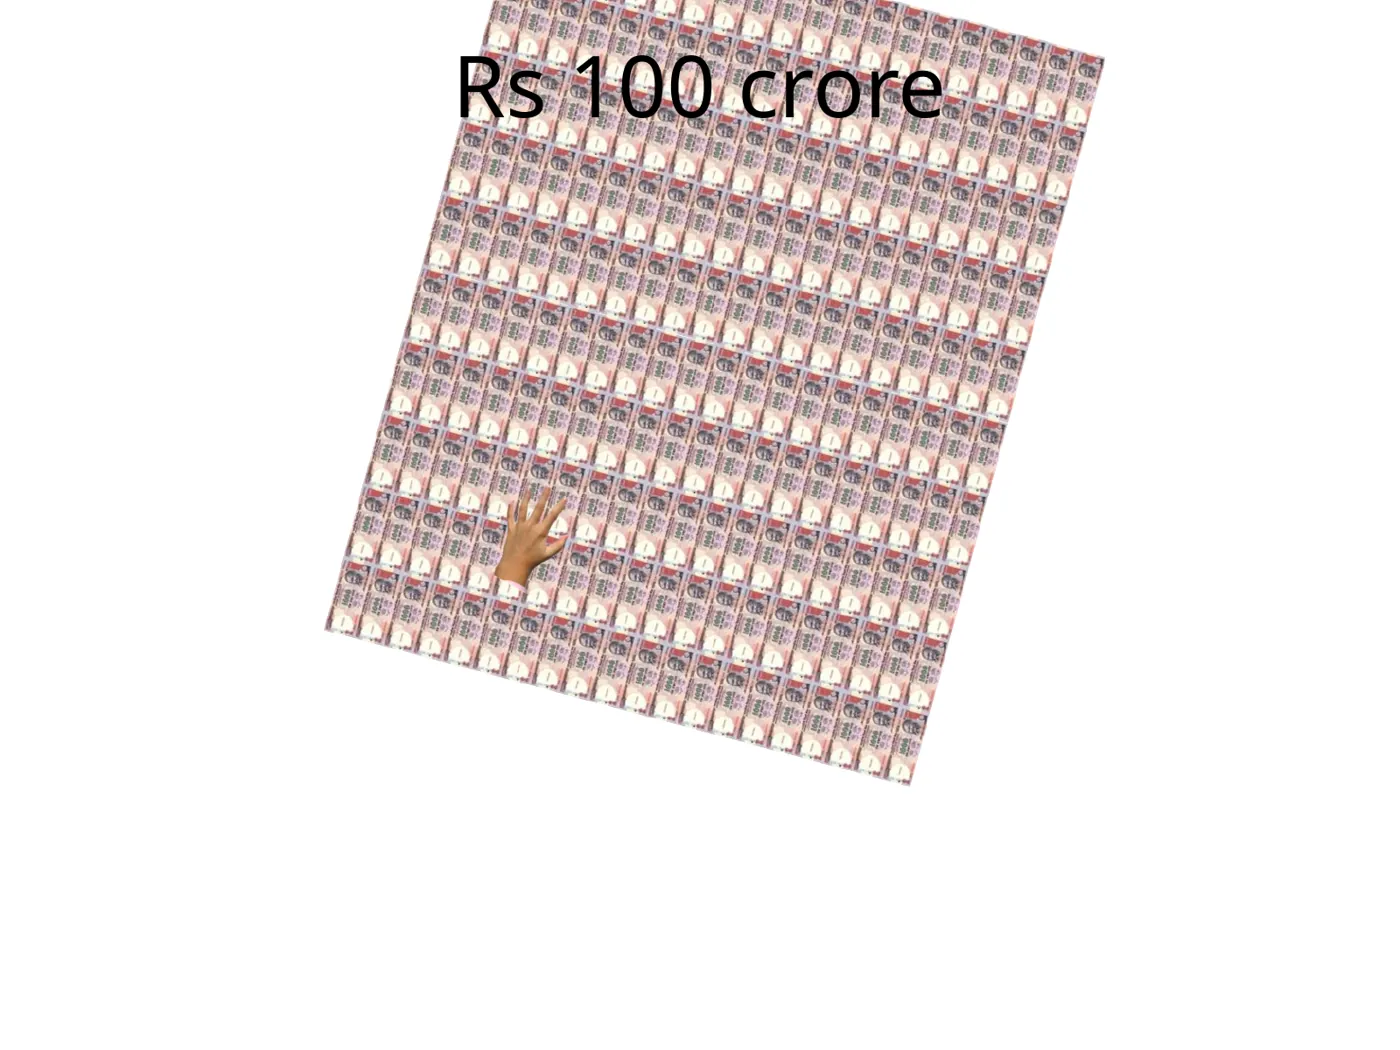
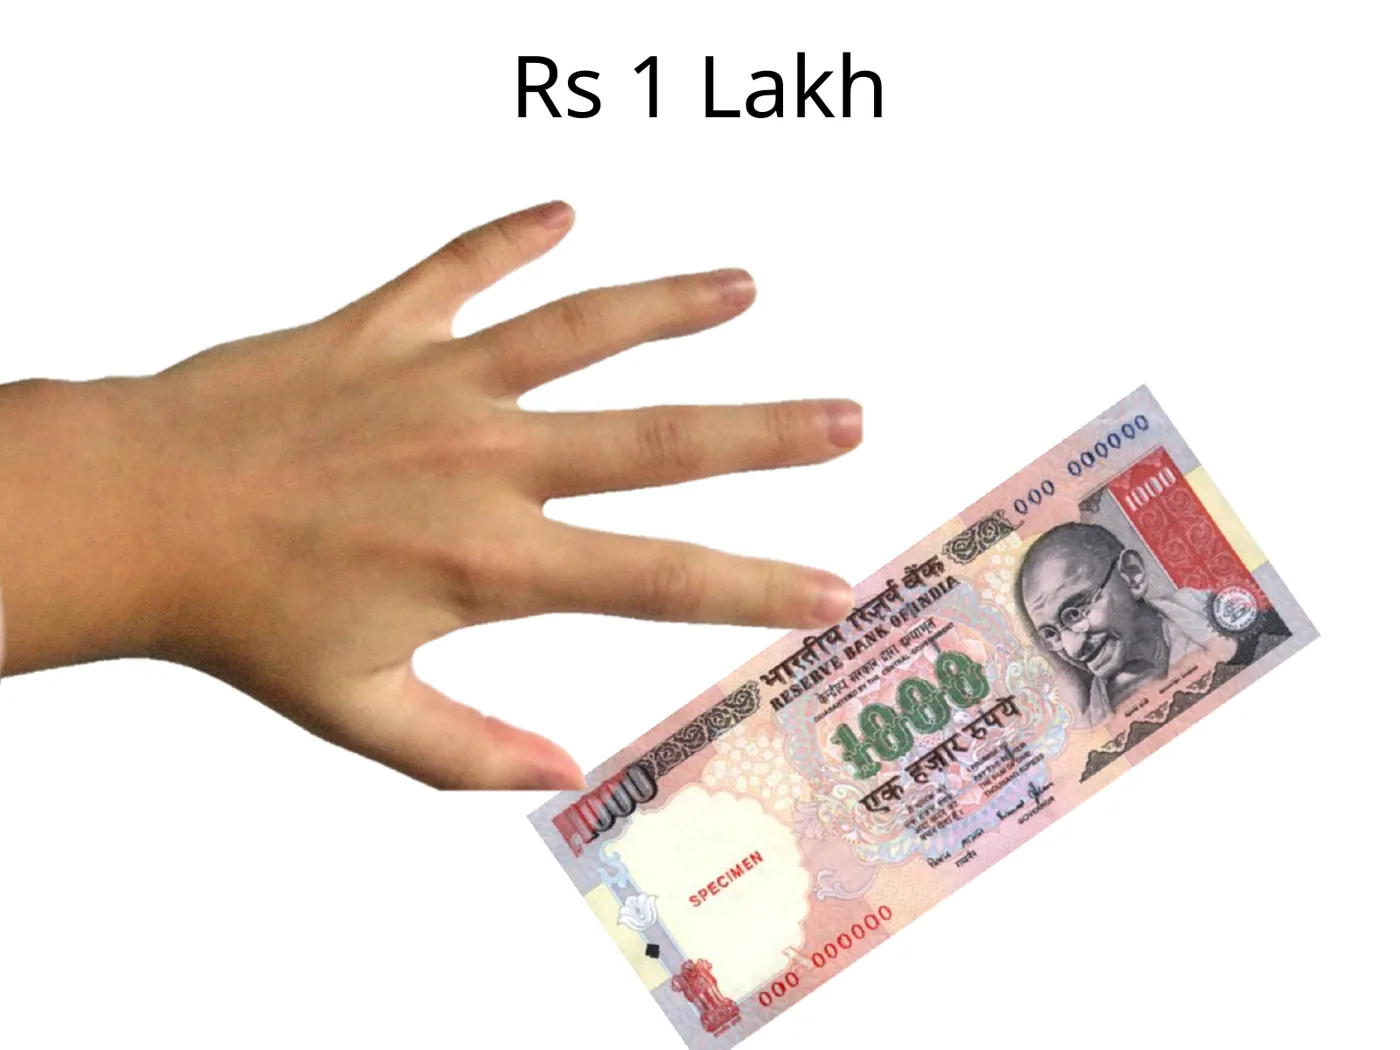
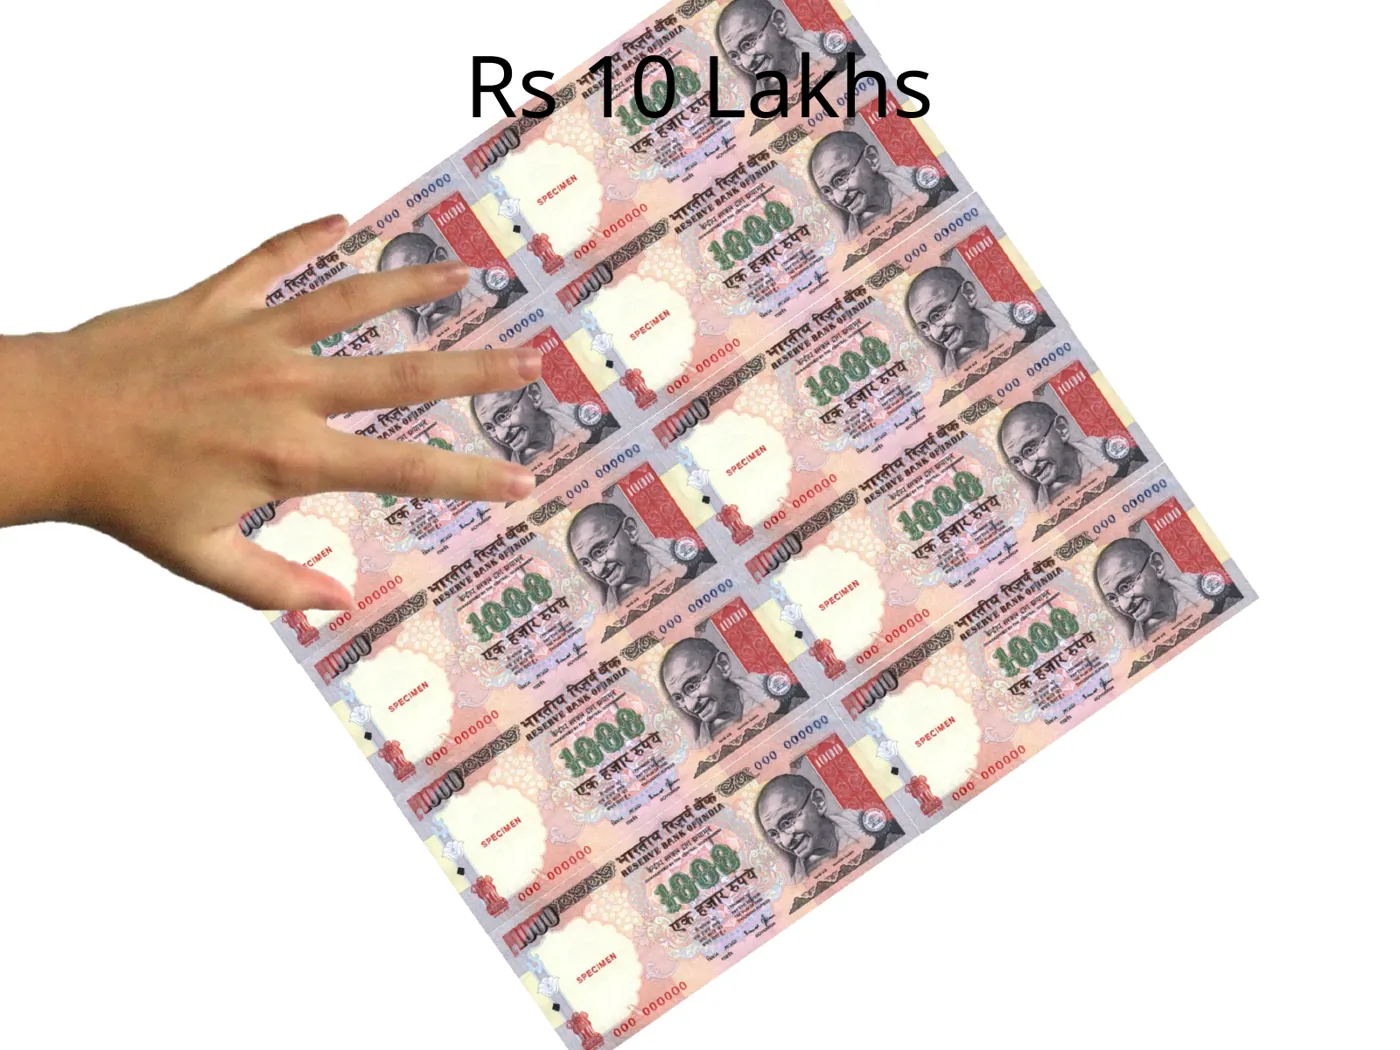
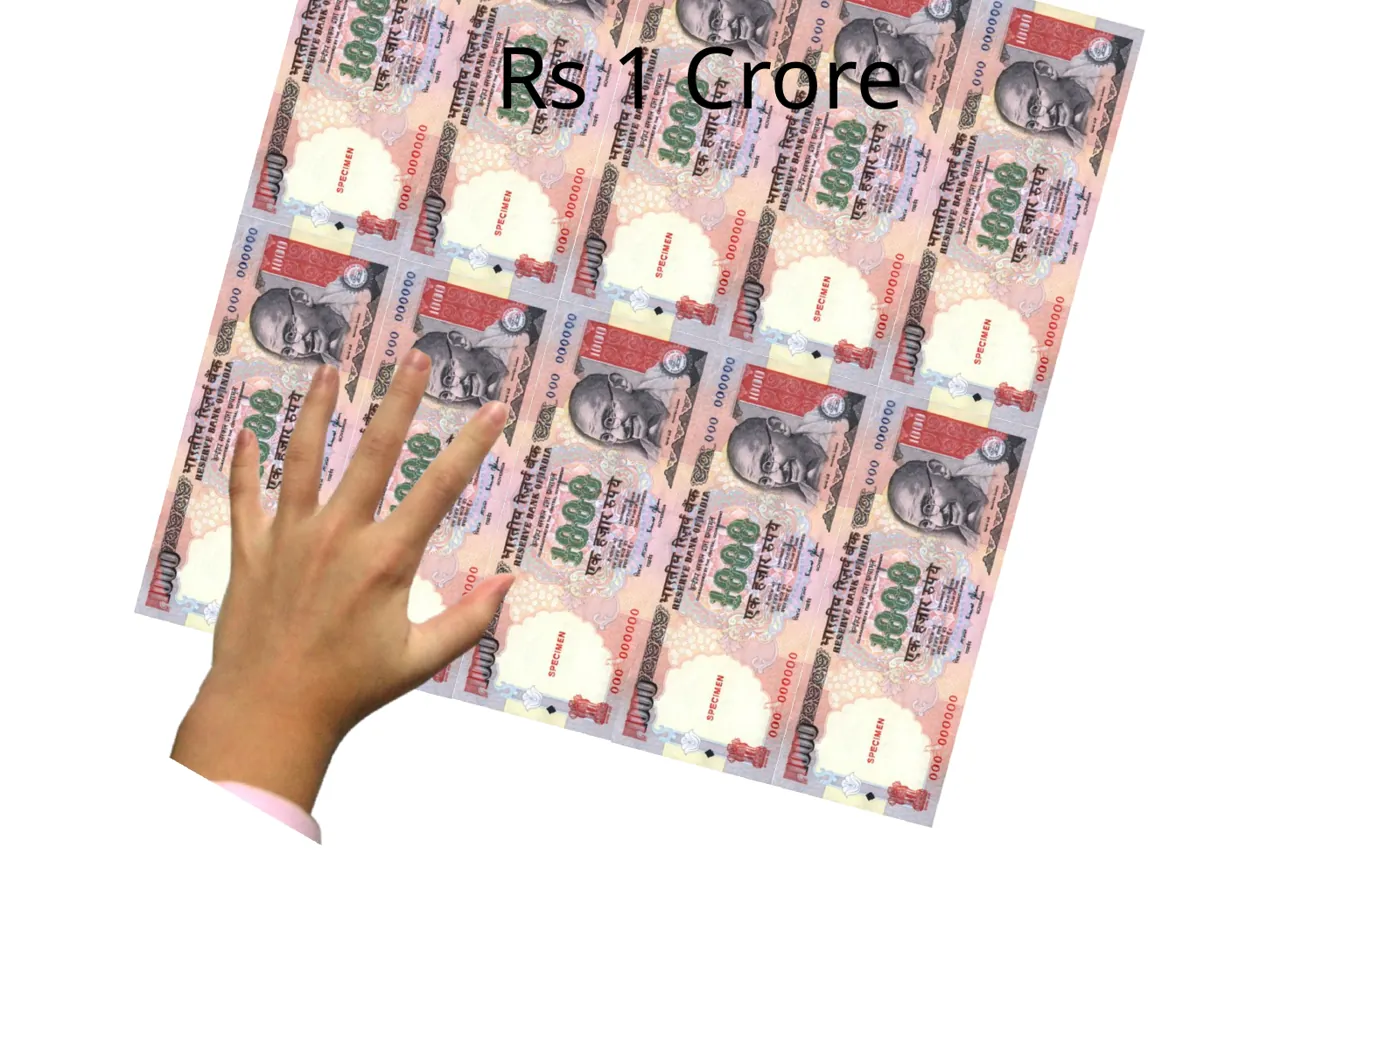
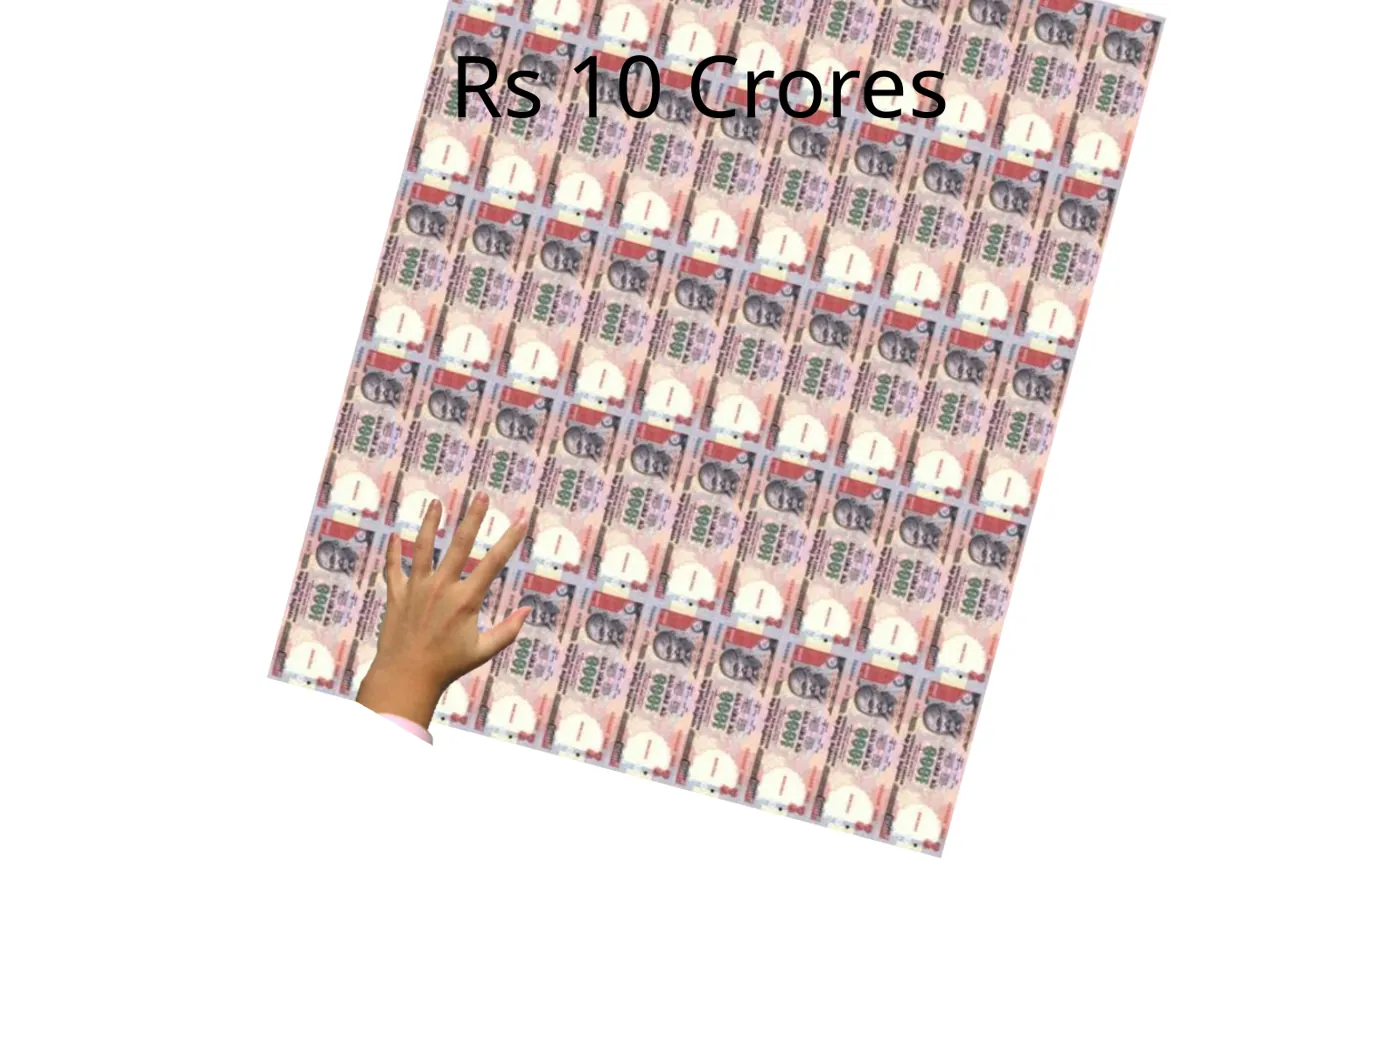
A hand holding a single bundle of ₹1,000 notes: ₹1 lakh. A hand resting on a book-sized block of ₹1,000 note bundles: ₹10 lakh. A hand on a briefcase-sized slab of note bundles: ₹1 crore. A tall stack of note bundles with a tiny hand for scale: ₹10 crore. A bed-sized block of note bundles with a small hand for scale: ₹100 crore. A woman standing beside a room-height block of note bundles: ₹1,000 crore. A tiny woman beside an enormous block of note bundles: ₹10,000 crore. The Vidhana Soudha in Bengaluru with its entrance covered by a grid of ₹1,000 notes, banknotes flying above, and a circled photo of Priya Krishna.

₹1 lakh

Fits in your hand

“If you take one lakh, that's something you can hold in your hand.” 01:55

Scale is logarithmic: each tick is ten times the last. The amber pin marks ₹767 crore. The slides draw ₹1,000 notes, a denomination withdrawn in November 2016.

Then came the awkward moment the editorial team had to face. The honest picture was smaller than the dramatic one.

“Now, at this point, we realized we have a problem because 767 crores is not even going to fill the Vidhana Soudha. It's not even going to fill a small room.”

They didn't inflate the number to fit the picture. They shrank the picture to fit the number: not the whole legislature, just its doorway. It's a small decision, and it's the one that counts in data journalism. When the metaphor and the measurement disagree, change the metaphor.

Context check · assets aren't banknotesThe ladder answers “how big is this number?”, not “how much cash did anyone hold?” Declared assets are mostly shares, property, deposits and loans, and they're gross figures before liabilities. Nobody claimed that a building's worth of notes existed.

The next year, the question scaled up, and so did the problem. In the 2014 Lok Sabha election, the Congress candidate for Bangalore South, Infosys co-founder Nandan Nilekani, declared about ₹7,700 crore.NDTV 2014 On the national treemap he “crowded out the whole thing” 03:02.
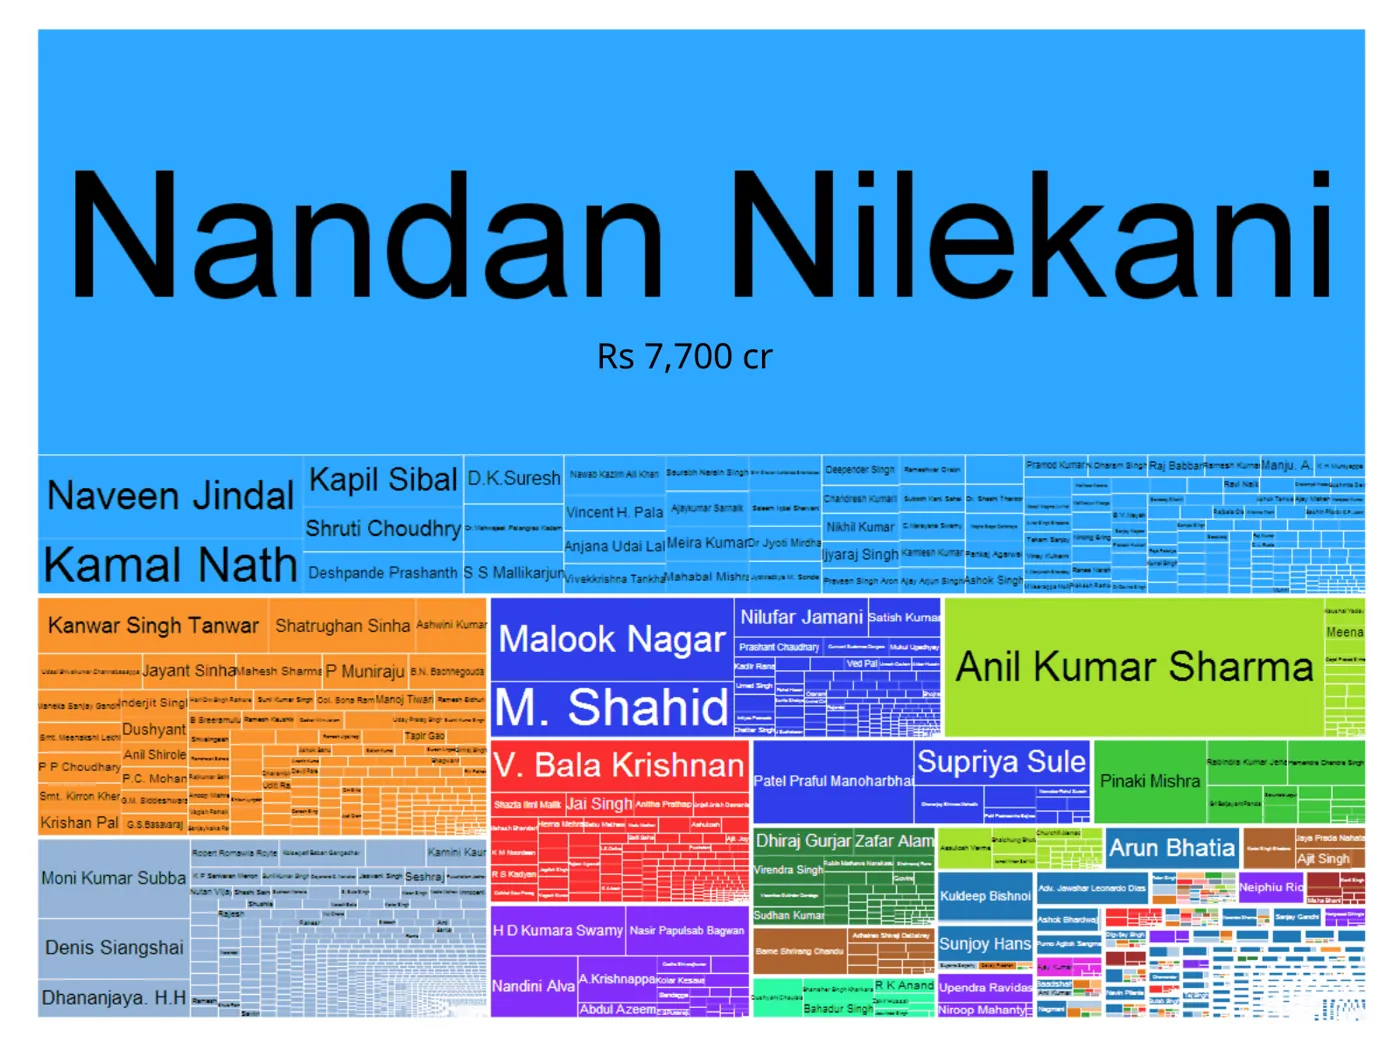
Treemap of 2014 Lok Sabha candidates' assets. A single blue box labelled Nandan Nilekani, Rs 7,700 cr, fills the top half; below it, much smaller boxes for candidates such as Naveen Jindal, Kamal Nath, Kapil Sibal and others.
2014 Lok Sabha candidates, sized by declared assets. One box takes the top half.

“He could buy the election out completely,” Anand joked 03:31. It got a laugh, and it's a joke, not a finding. Shares in a company you co-founded don't turn into votes.

04 Lok Sabha · 2014

The chart that looked like a verdict

Candidates' affidavits list more than assets. They also list pending criminal cases. So the team grouped the 2014 declarations by party, and the chart said something nobody expected.

“What we found was AAP was right there on top, the Aam Aadmi Party. Which made no sense whatsoever.”
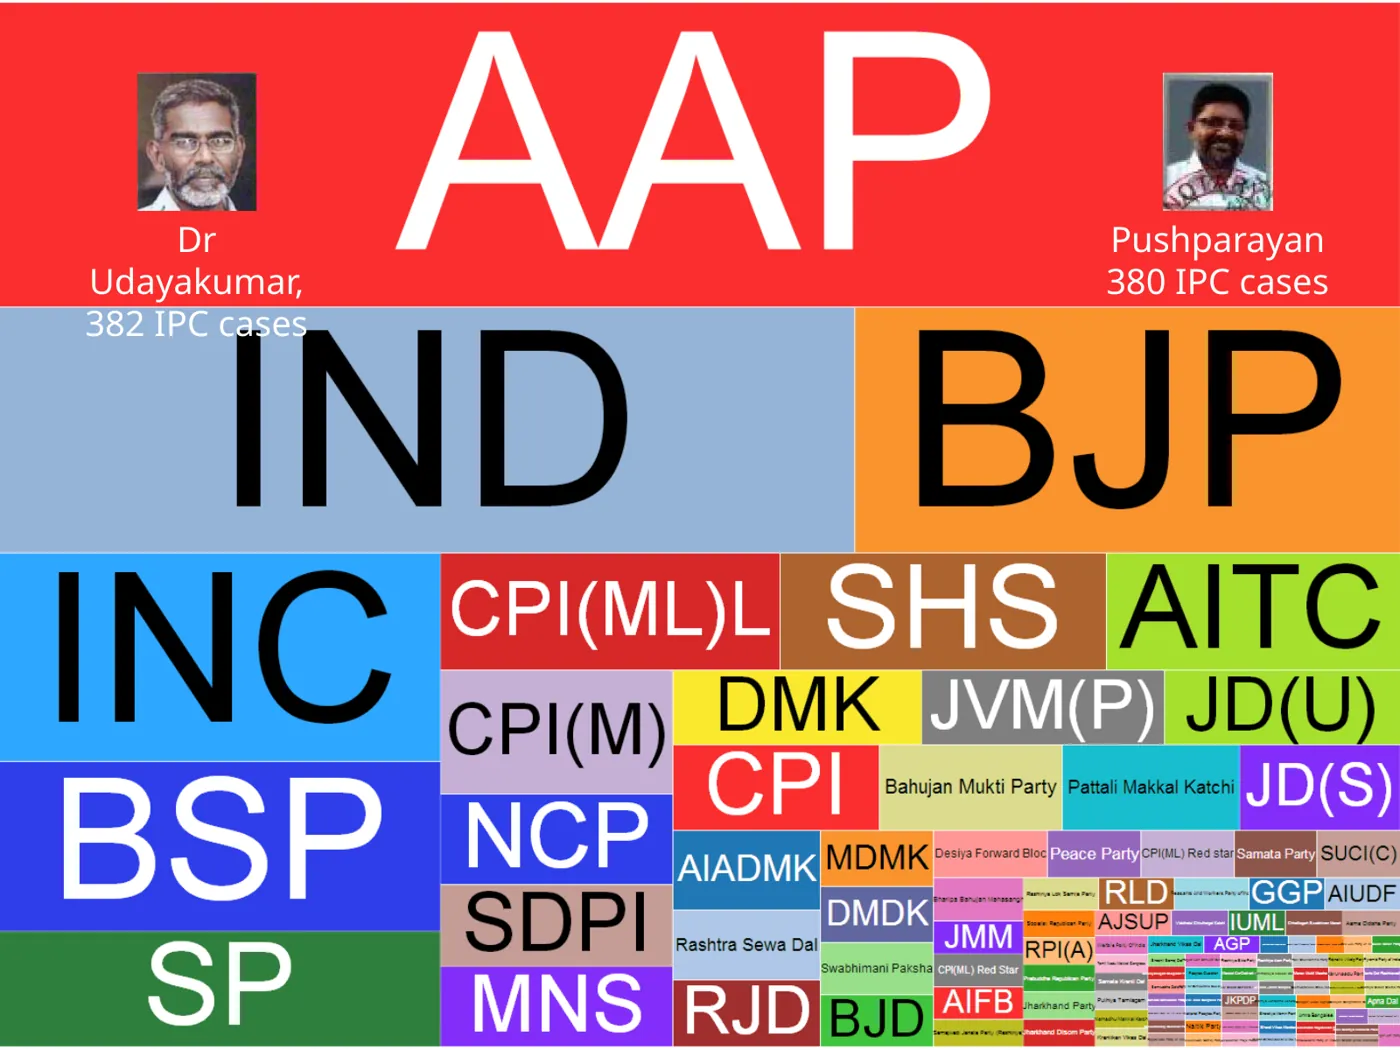
Treemap of declared criminal cases by party. A red AAP box spans the top, with photos labelled Dr Udayakumar, 382 IPC cases, and Pushparayan, 380 IPC cases. Below are IND, BJP, INC, BSP, SP and dozens of smaller parties.
Declared cases against 2014 candidates, by party. AAP sits on top, and the reason is in the two photos.
First impressionThe newest anti-corruption party has the most cases. That's a headline, if you're careless.
Look inside the boxMost of it is two people. Dr S P Udayakumar had 382 declared cases and M Pushparayan had 380 04:00.
What the record saysADR lists both as AAP candidates in Tamil Nadu (Kanniyakumari and Thoothukkudi) and both as anti-nuclear activists. That's context for the count. It isn't a verdict on either man.ADR 2014

“Now, of course, these are activists, and it is their job to protest against various things and go to jail.”

He was half joking. He also said that the cases came under “somewhat serious IPC sections, but mostly for social agitation”. Both halves matter. A party total built from two people is really a fact about those two people. And a pile of filings is a different thing from a pile of crimes.

Context check · cases are not convictionsThe affidavits list declared, pending cases. They aren't convictions, and a count says nothing about how serious each case is or how it ended. The chart ranked parties by total filings. It didn't measure a rate or risk, and it couldn't decide guilt. Primary data: the National Election Watch / ADR press release and MyNeta's 2014 candidates sorted by cases.
05 CNN-IBN · 2014

The anchor becomes an analyst

So far the team had been finding the stories themselves. The next step was bolder: give the data to someone live on air.

“The role of an anchor is normally to come out there and read a prepared script. Can we transform an anchor into an analyst who will take a call and, as these calls come through, answer the questions just by playing around with the data live?”
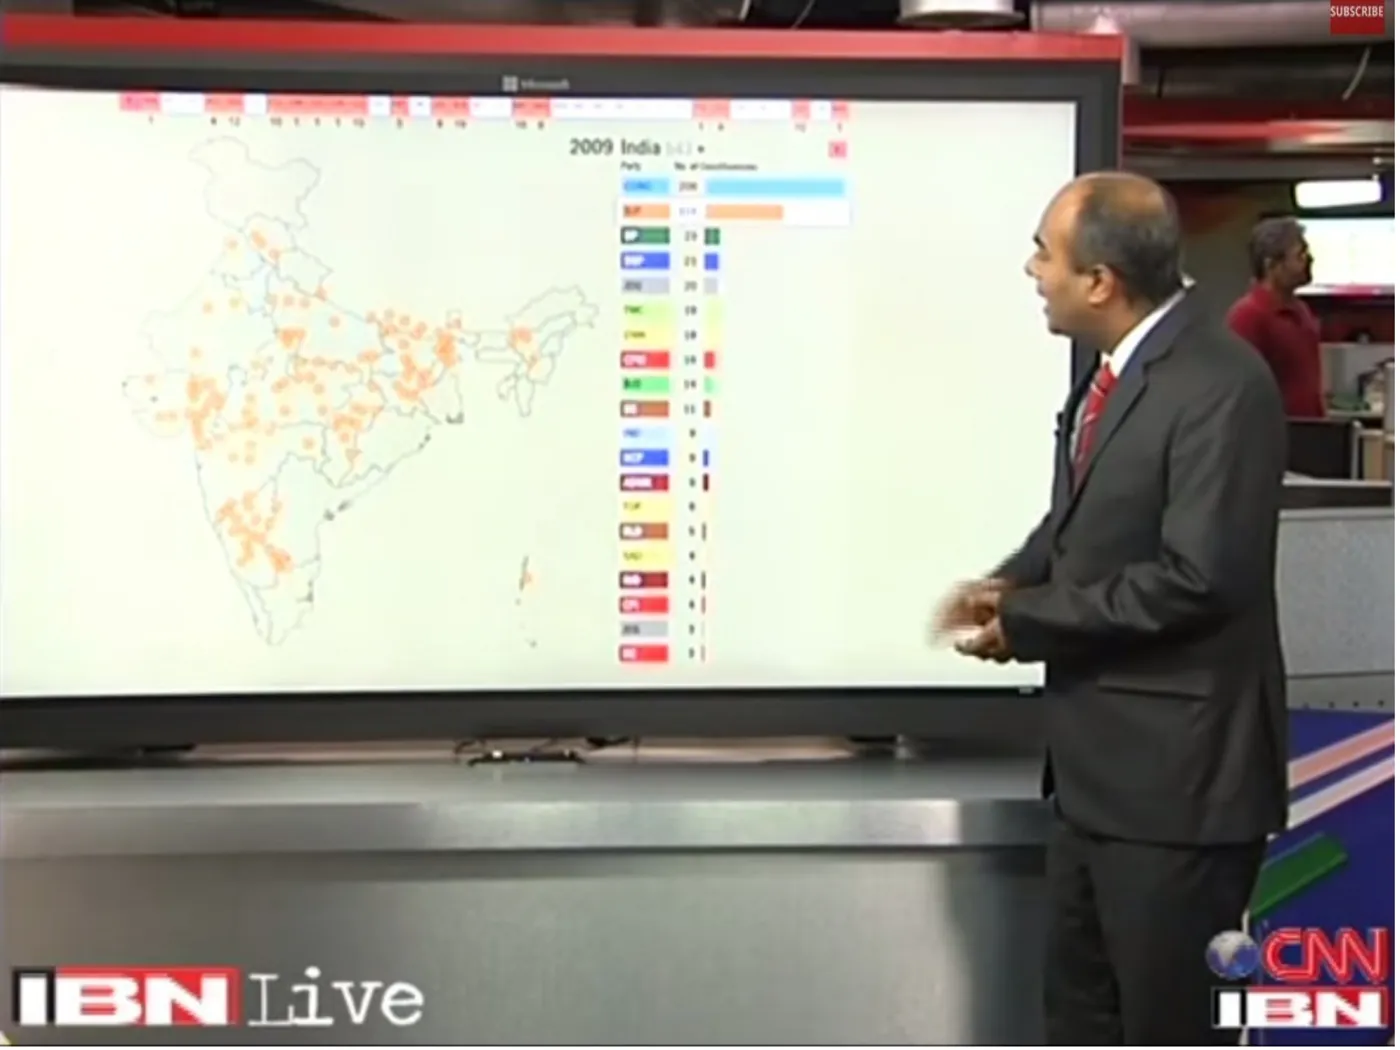
A 98-inch touchscreen at CNN-IBN
TV still with IBN Live and CNN-IBN logos. A suited anchor gestures at a huge touchscreen showing a map of India dotted with constituencies and a bar list of party seat counts for 2009. In the background on the right stands a man in a red T-shirt.
A broadcast still from the slides. The screen is showing 2009 results. At the back right is a man in a red T-shirt.

“That's me in the red T-shirt at the back making my first television appearance. And first thing that I did as soon as I got behind the screen was called home and said, ‘Look, turn on CNN-IBN, you'll see me.’”

The screen changed who could ask the questions. A script only answers what someone predicted viewers would want to know. A live screen lets the anchor answer whatever comes in next, and anchor Bhupendra Chaubey could do that on air 06:03. “The kinds of questions that came to them were bizarre,” Anand said 05:38.
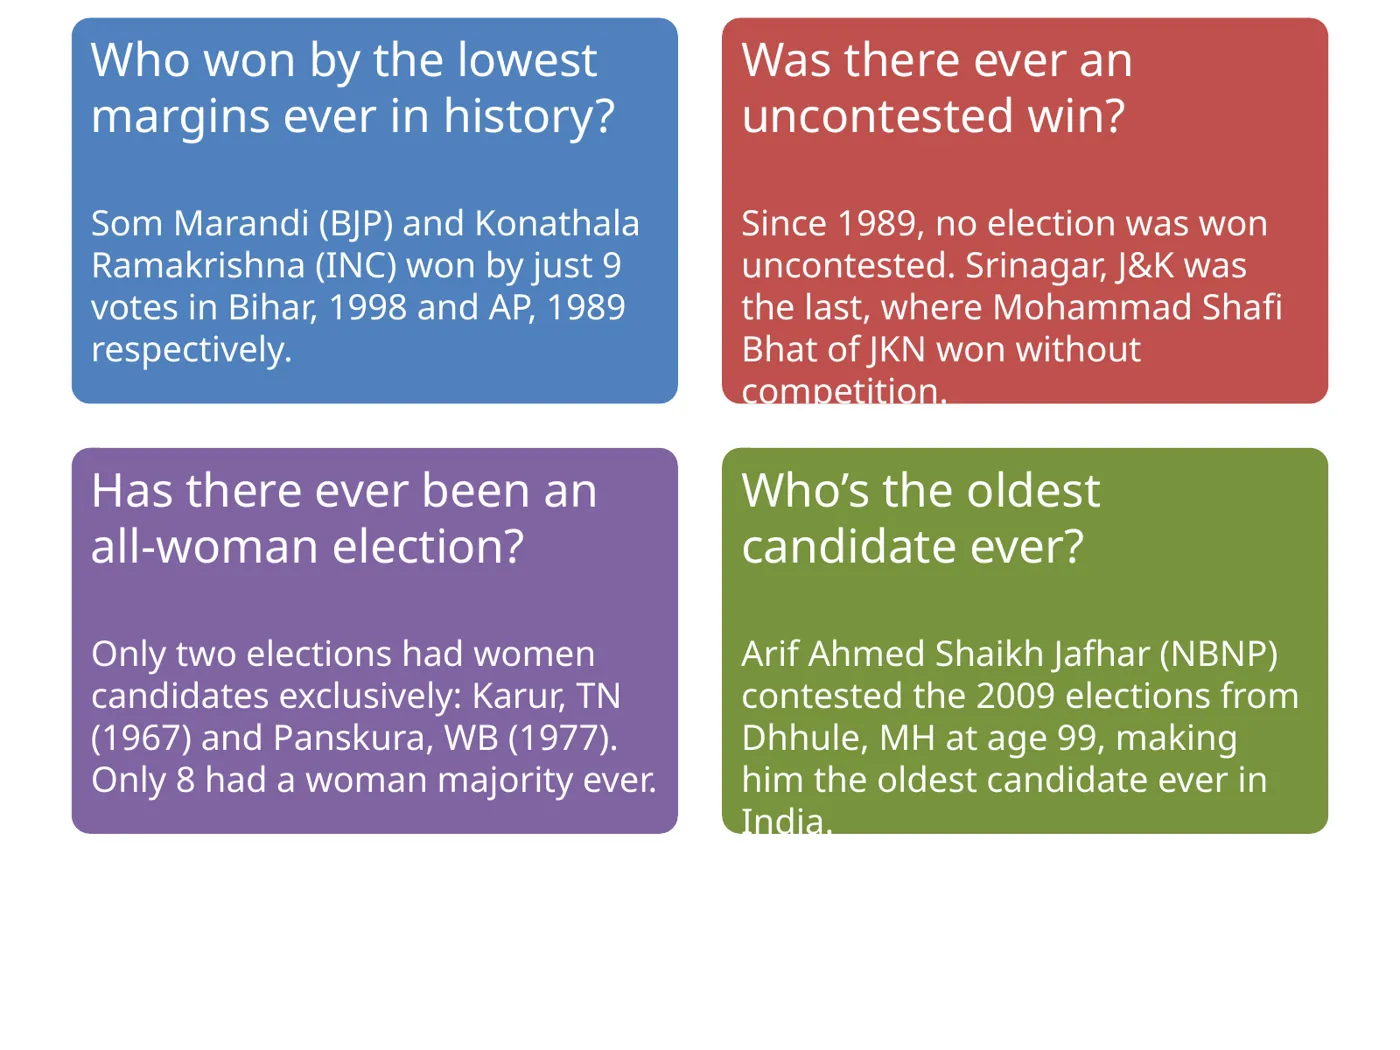
Four coloured cards. Lowest margins: Som Marandi (BJP) and Konathala Ramakrishna (INC) won by just 9 votes in Bihar, 1998 and AP, 1989. Uncontested: since 1989 no election was won uncontested; Srinagar, J&K was the last, Mohammad Shafi Bhat of JKN. All-woman elections: only two, Karur, TN (1967) and Panskura, WB (1977); only 8 had a woman majority. Oldest candidate: Arif Ahmed Shaikh Jafhar (NBNP), Dhule, Maharashtra, 2009, aged 99.
Questions no one wrote a script for: a nine-vote win, the last uncontested seat, the two all-woman contests, and a 99-year-old candidate.

Who won by the smallest margin ever? Two candidates, by nine votes each, “so if, for instance, their family had voted the other way, it would probably have made a difference” 05:42. Has anyone contested alone? Not since 1989 06:03. And the oldest candidate was 99: “what you would do if you won the election at the age of 99 is a tough question to answer” 06:47.

Context check · trivia, as presentedThese are Lok Sabha answers from Gramener's 2014 dataset and haven't been re-audited here. The slide and the speech disagree on one date: Anand said the nine-vote wins came in “1998 and 1999”, but the slide dates the Andhra Pradesh one to 1989. The family-vote line is a joke, not a counterfactual.
06 1984 · 1989 · 1991

The party that never won

If there are winning parties, there might be a losing champion. “Which is the least successful party?” 07:00 The data had an answer most of the audience had never heard of: the Doordarshi Party.

“There was only one party that was larger than them in terms of presence, and that was the Congress. So this is effectively the second largest party, and they won zero.”

“Largest” here means the number of candidates fielded, not votes. The slide puts the party ahead of the BSP (245), JD (244) and BJP (225) in 1989. Worse, Anand said, its candidates were never even runners-up 08:04. Then he offered a theory: its candidates “had to be teetotalers, non-smoking, vegetarian, bachelors, and I think celibate as well, I'm not sure” 08:14.
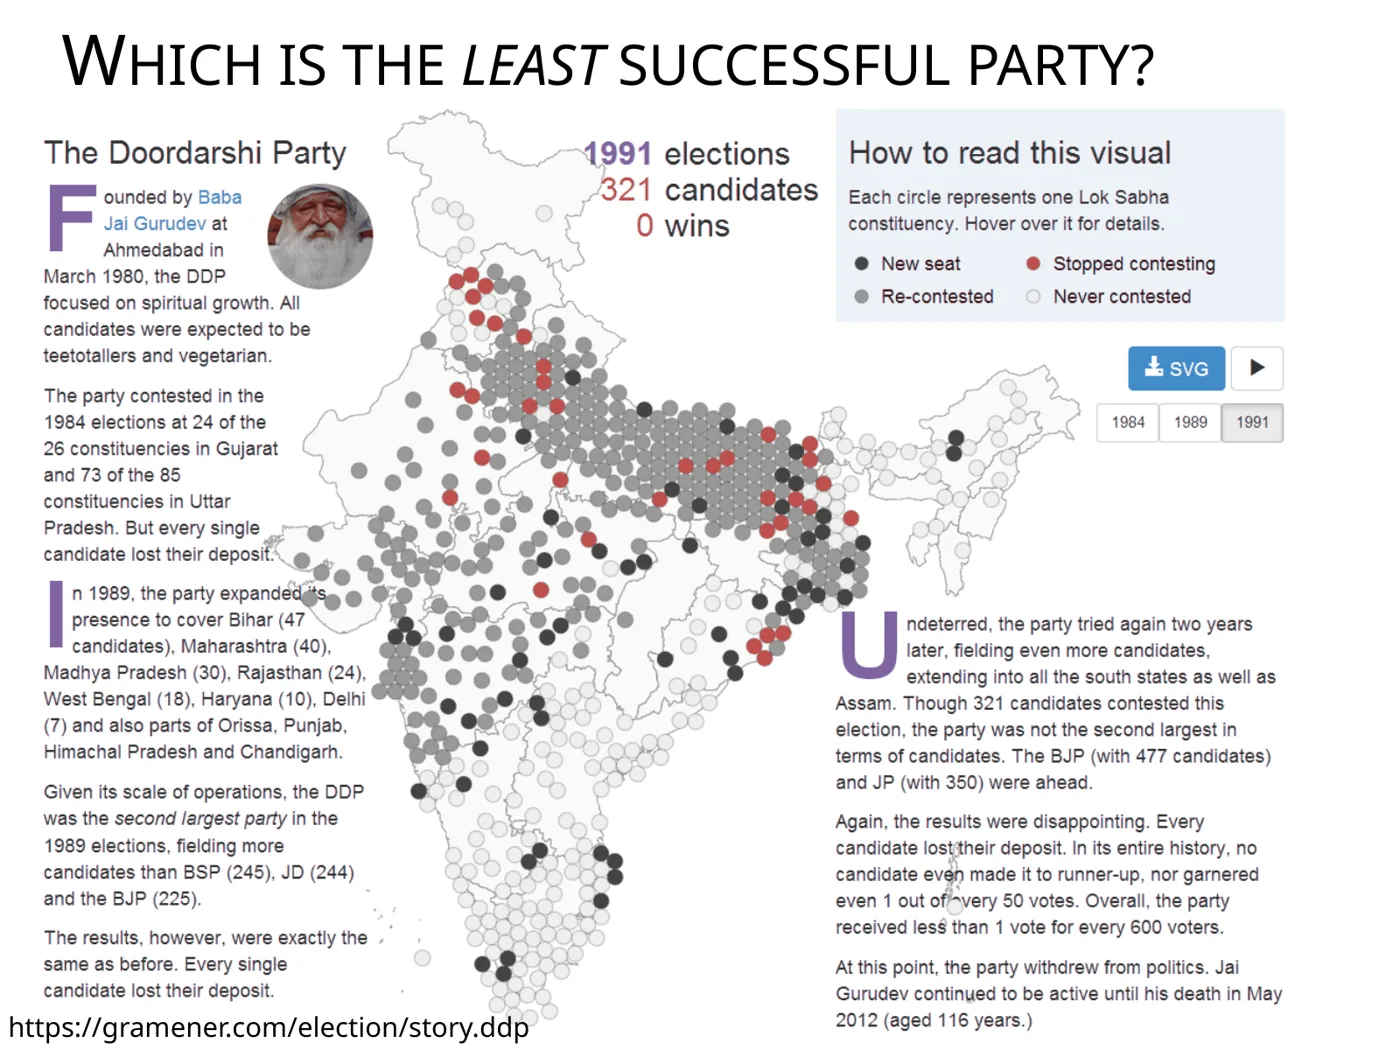
Slide titled “Which is the least successful party?” showing Gramener's Doordarshi Party story: text on its founding by Baba Jai Gurudev in 1980, a dot map of India's Lok Sabha constituencies for 1991 (321 candidates, 0 wins), and notes that every candidate lost their deposit.
Gramener's 2014 story on the party. Its URL (gramener.com/election/story.ddp) is now dead, and the slide is what survives. Founded by Baba Jai Gurudev, the party asked its candidates to be teetotallers and vegetarians, and every one of them lost their deposit.
Context check · two numbers and a joke1989: Gramener's graphic says 298 candidates, but Wikipedia says 288. The talk's figure is kept here, and the official returns would settle it. The rules: Gramener's own story lists teetotal and vegetarian requirements. “Bachelors” and “celibate” were Anand's guesses, and he said so.

One more question went the other way: is there a constituency that always picks the winner? 08:36 Faridabad, in Haryana, had voted for the nationally leading party in every election since it was created.
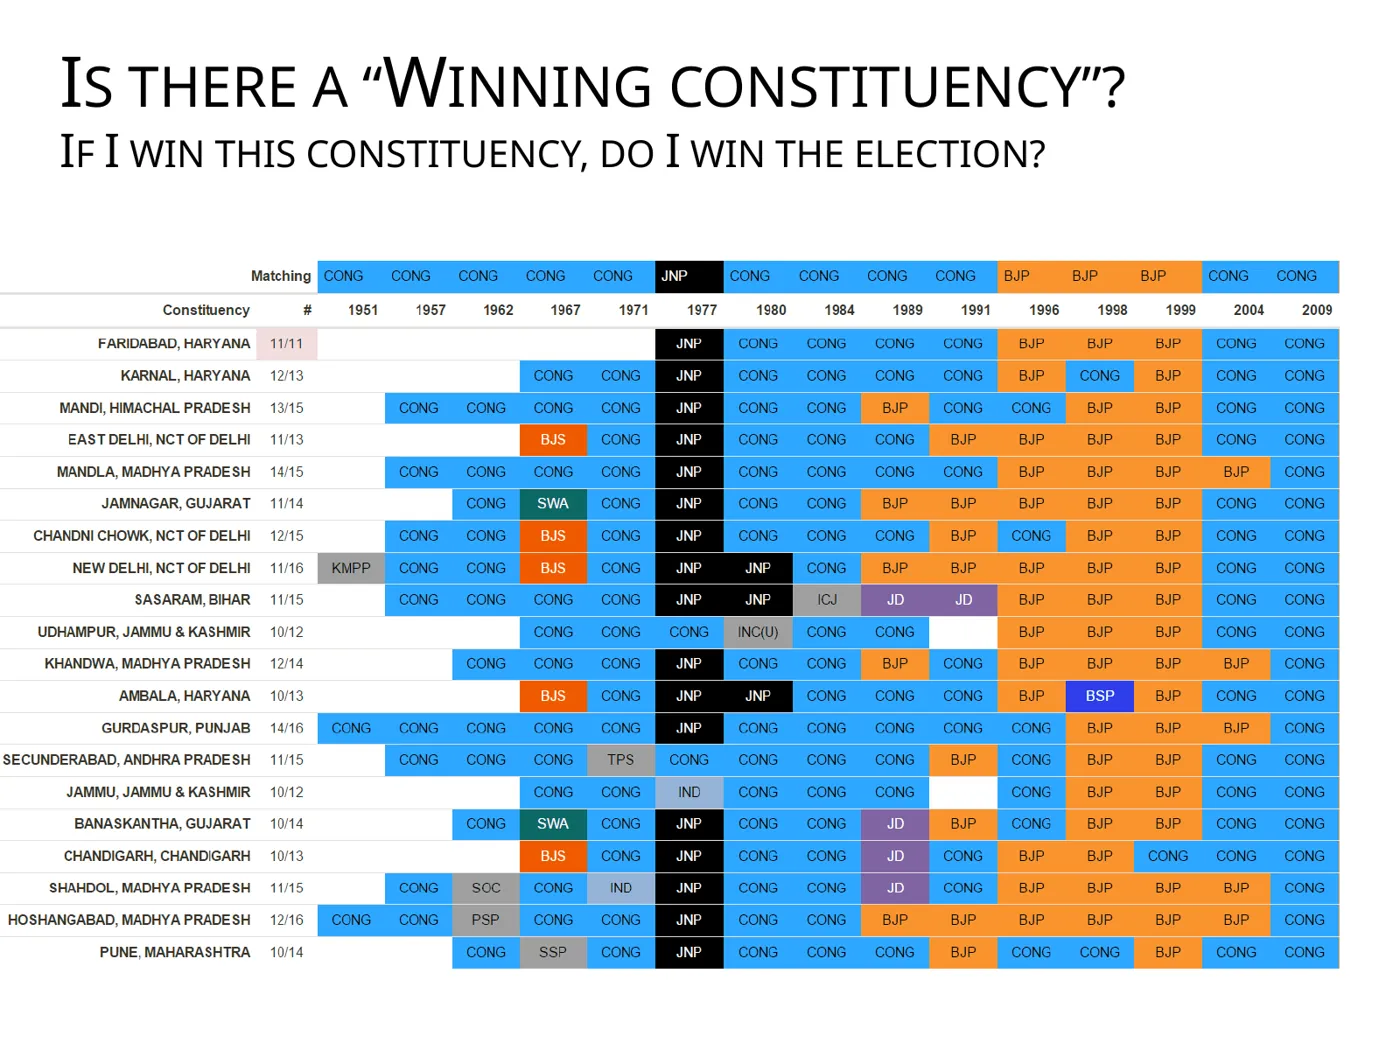
Grid with elections 1951 to 2009 across and constituencies down. The top row shows the national leader each year (CONG, JNP in 1977, BJP 1996–99, CONG 2004–09). Faridabad, Haryana, scores 11/11; Karnal 12/13, Mandi 13/15, East Delhi 11/13 and others follow.
Faridabad scores 11 out of 11 from 1977 to 2009. Anand adds that it kept the streak in 2014 09:18.

This is a bellwether, not a lever. A streak shows that a seat has matched the winner. It doesn't show that the seat causes or predicts the result. Whether it's the only such seat depends on how you treat new constituencies and boundary changes.

07 Tamil Nadu · 1967–1996

Back to the booklet

With two minutes left, Anand asked the question this story opened with. “What is the largest number of people that ever stood for an election? … I'll show you the answer and you'll find it quite striking.” 09:40

He didn't just show the number. He played a map of Tamil Nadu's Assembly elections, one circle per constituency, each circle sized by its number of candidates, and stepped through the years. In 1967 Perambalur had about ten candidates 10:01. The 1977 map was busier, and in 1984 one circle had 90:

“So at this point, you're not looking at a ballot sheet; you're looking at a ballot booklet, right? You've got to flip pages to get there.”

In 1991 two seats had around 250 candidates each, a “mini book, half of the telephone directory, perhaps” 11:02. “But all of this pales in comparison with the 1996 elections where Modakurichi had 1,033 candidates.” 11:05
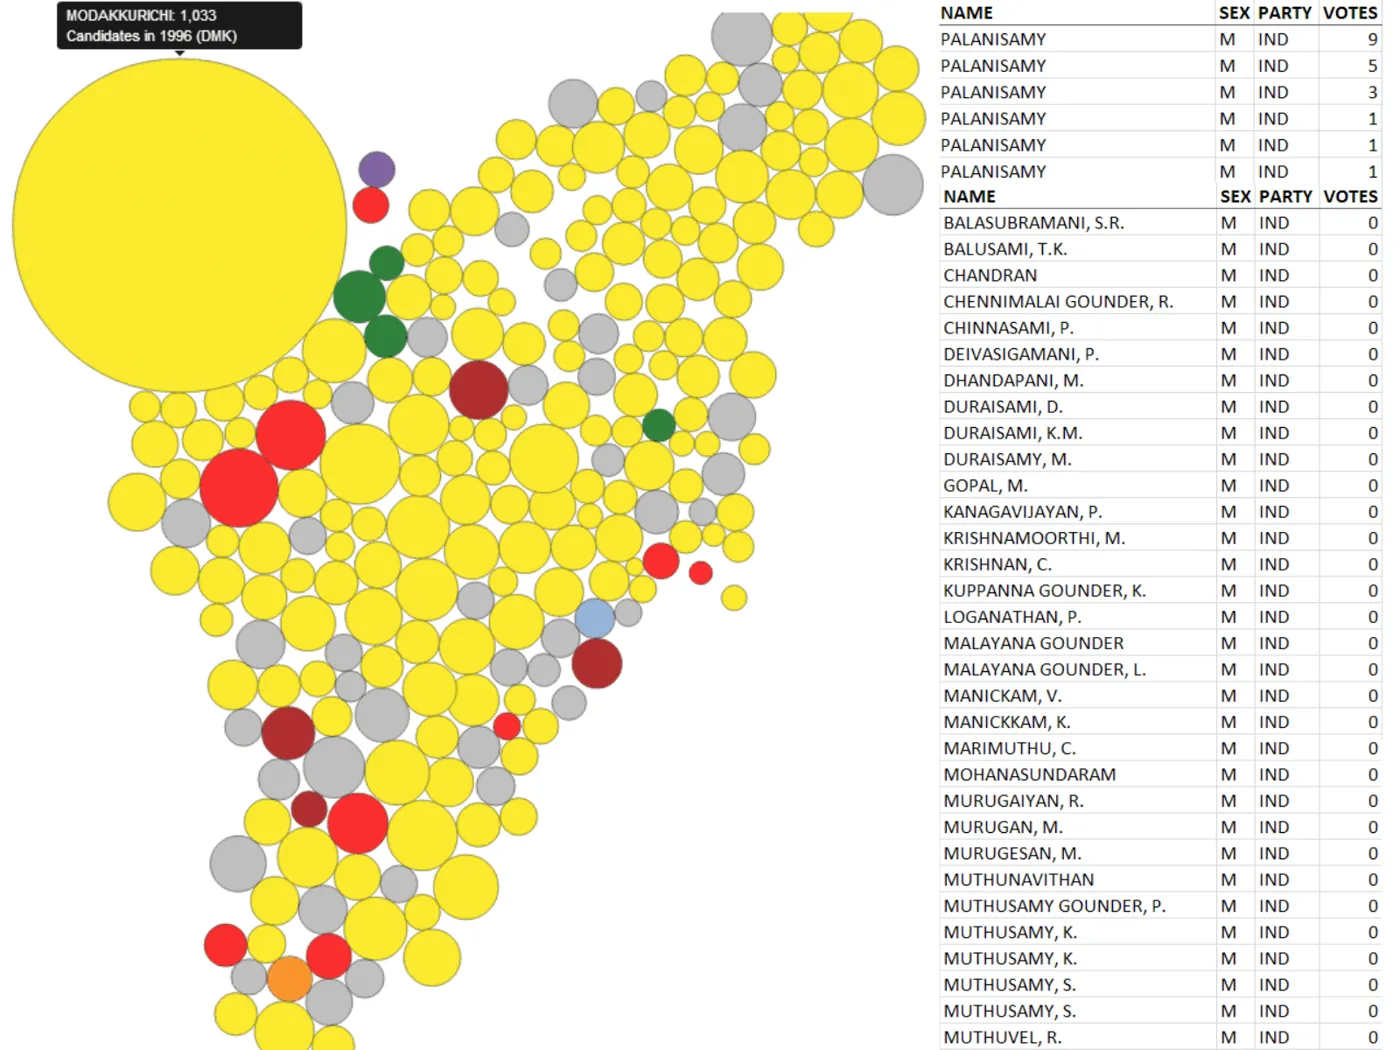
The last frame of the map · 1996
Bubble map of Tamil Nadu constituencies, mostly small yellow, red, green and grey circles, with one enormous yellow circle at top left labelled MODAKKURICHI: 1,033 Candidates in 1996 (DMK). On the right, a table: six rows of PALANISAMY, male, independent, with 9, 5, 3, 1, 1 and 1 votes; then a list of independents from Balasubramani S.R. to Muthuvel R., each with 0 votes.
One circle swallows the corner of the state. On the right are rows from the actual 1996 result: six Palanisamys, all independents, with 9, 5, 3, 1, 1 and 1 votes, followed by candidates who got none.

“Palanisamy C, Palanisamy C, Palanisamy C, Palanisamy C… How do you figure out which Palanisamy C you are if you're voting for yourself?”

1,033 candidates, one square each

88 got zero votes 158 got exactly one 3 kept their deposits the other 784

A reconstruction, not the ballot: squares aren't in ballot order. The counts come from a 2016 DT Next retrospective. A 2021 interview gives 161 one-vote candidates instead of 158.

“There were as many as 88 candidates who got exactly zero votes. Probably because they couldn't find themselves or the Election Commission couldn't find them…”

That's a joke, and the room laughed. But think about what eighty-eight zeros means. Eighty-eight people filed nominations, had their names printed, and then didn't vote for themselves. Nobody who wants to win does that. So what did they want?

“We figured out finally why this happened. This was a farmers' protest.”

08 Erode district · 1996

Not to win, but to be heard

The candidates weren't confused, and the data wasn't broken. Modakurichi's farmers had filed en masse on purpose, to make an election impossible to ignore. Their federation had a charter of demands that had gone unanswered: 33 of them by one later account, 32 by another. So they took the demands to the ballot itself. More than a thousand of them stood as independents.TNIE 2021 DT Next 2016

“Our goal was not to win but to be heard.”

It worked, at least as theatre. Polling was pushed back a month. Chief Election Commissioner T N Seshan came to Modakurichi and met them, and Nallasamy says Seshan called their reform demands just.TNIE 2026 The twist in those demands is the best part. One of them was to raise the candidate's deposit from ₹250 to ₹10,000 and to require ten proposers instead of one. The protesters were asking for the rule that would end their own protest. Another was a way to reject all the candidates.

Today an Assembly deposit is ₹10,000, and NOTA (“none of the above”) has been on Indian ballots since a 2013 Supreme Court ruling.ECI The 2021 account counts these as demands met. It doesn't show that Modakurichi caused either change, and both had wider histories of their own.

Context check · who says whyEvery account linked here was published after the talk, between 2016 and 2026, and they don't fully agree. Anand's version on stage (the committee aimed “to give everybody 500 bucks and get as many as 5,000 people to stand” 11:51) isn't supported by them. Later accounts say 1,016, 1,029 or “over 1,000” farmers, and 1,088 or 1,350 nominations filed. In 2026 Nallasamy also said that, before the deadline, “we demanded money from party candidates to withdraw the papers of farmers”. The DMK winner, Subbulakshmi Jagadeesan, suggested an intra-party motive. Different sources give the booklet as 50 or 65 pages. The Election Commission settles only two things: 1,033 candidates and a booklet.

Even with the disagreements, the shape of the story holds. The strangest row in India's election data wasn't an error. It was the message. A cleaning script would have flagged it, and a careless analyst might have dropped it. A chart made it impossible to miss, and only asking “why?” made it mean anything.

09 Mahasamund · 2014

Eleven Chandu Sahus

Anand wasn't done with confusing names. Lookalike names on a ballot, he said, had rarely happened before. Then in 2014 they turned up “in a fairly strong way” 12:04.

“You may have heard of the case of the 11 Chandulal Sahus that stood for elections in Mahasamund.”
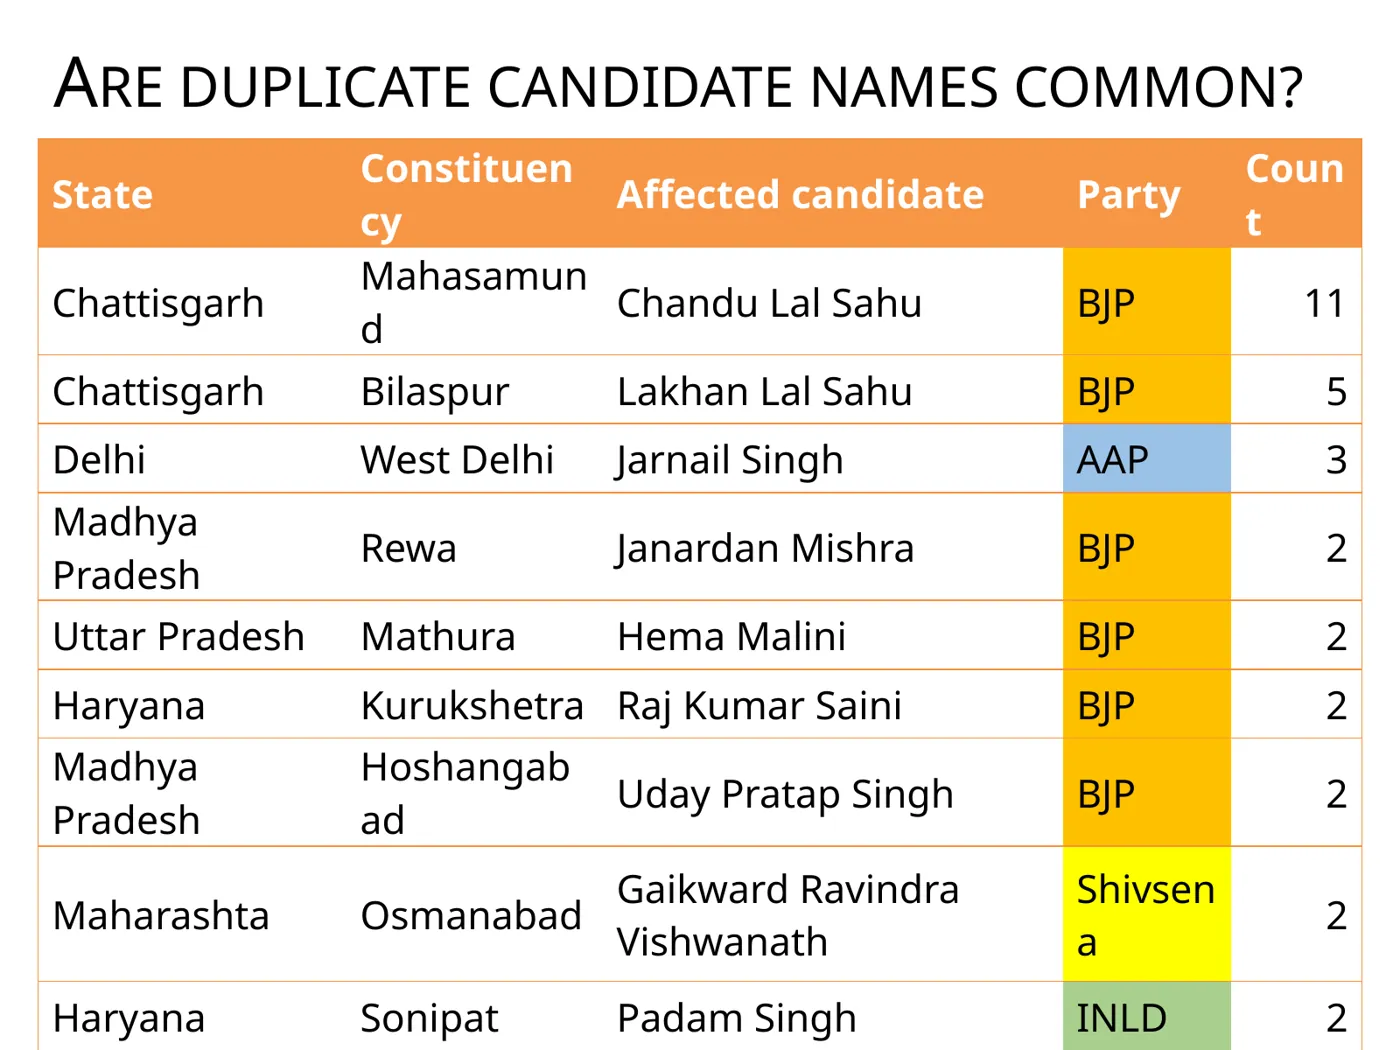
Table titled “Are duplicate candidate names common?” Columns: state, constituency, affected candidate, party, count. Rows: Chhattisgarh, Mahasamund, Chandu Lal Sahu, BJP, 11; Chhattisgarh, Bilaspur, Lakhan Lal Sahu, BJP, 5; Delhi, West Delhi, Jarnail Singh, AAP, 3; Madhya Pradesh, Rewa, Janardan Mishra, BJP, 2; Uttar Pradesh, Mathura, Hema Malini, BJP, 2; Haryana, Kurukshetra, Raj Kumar Saini, BJP, 2; Madhya Pradesh, Hoshangabad, Uday Pratap Singh, BJP, 2; Maharashtra, Osmanabad, Gaikwad Ravindra Vishwanath, Shiv Sena, 2; Haryana, Sonipat, Padam Singh, INLD, 2.
2014 seats where a candidate faced namesakes, with the affected candidate's party. Congress doesn't appear in this column.

Contemporary reporting was more careful than the shorthand. The Hindustan Times said the BJP's sitting MP faced ten namesakes, five Chandulal Sahus and six Chanduram Sahus. The BJP alleged that Congress candidate Ajit Jogi had planted them, and Jogi brushed the allegation aside. The Indian Express reported the dummy-candidate claims too. Those are claims. Anand pointed at the column that suggested a pattern, and then stopped.

“In no place is Congress at a disadvantage. It's always some other party that seems to be suffering from it. I'm not making any conclusions from it… it's just an observation.”

Seeing

In 2014, the candidates who faced namesakes in this table were from BJP, AAP, Shiv Sena and INLD, and none were from Congress. The chart can show that.

Understanding

That needs what the table doesn't hold: who filed, who paid, whether voters were confused, and how many votes the namesakes actually took.

Accusing

That needs evidence of intent. A chart can't supply it, and Anand, to his credit, didn't claim it.

10 The last ten seconds

Play around with data

The talk doesn't end on the accusation it avoided. The transcript this page started from stops at the namesakes, but the recording runs on for ten more seconds:

“Who would have thought that statistics can actually be as much fun, or perhaps even more, than politics? … Play around with data. You might find something interesting.”
— Anand, closing the talk 12:59
Dark closing slide reading “Sometimes, even statistics can be more fun than politics”, signed S Anand, Chief Data Scientist, Gramener.
The closing slide.

It's a light ending to a talk that's lighter than its material. Underneath the jokes, though, every story in it followed the same steps. Someone cleaned the data, asked a question, chose a picture, hit something odd, and looked again before deciding what it meant.

A reflection from the page's author, 2026 · not from the talk

The two big anomalies in this talk point in opposite directions. Modakurichi looked like a data error and turned out to be a protest. Mahasamund looked like a pattern and could easily have been turned into an accusation. Neither could be read off the chart. The habit worth keeping is a question to ask before you delete, merge or headline the outlier: what human decision could explain the strangest row in your spreadsheet?

Takeaways

Four habits from a 2015 talk

Each one comes from a moment where the first reading of the data was wrong.

01

Clean, but don't over-clean

Madhira and Madira are one place. Chennur and Chinnur are two. A wrong merge does more damage than a typo because nobody can see it. 00:42

02

Keep the scale honest

₹767 crore wouldn't fill the Vidhana Soudha, so they covered its doorway instead. When the metaphor and the measurement disagree, change the metaphor. 02:54

03

Open the biggest box

AAP's “most cases” turned out to be mostly two anti-nuclear activists. Pending cases aren't convictions, and a total isn't a rate. 04:00

04

The outlier may be a message

1,033 candidates wasn't an error. It was farmers using the ballot itself. Ask what human decision made the strange row before you drop it. 11:49

✓ Evidence ledger

What the talk said, and what the record says

Quotes are Anand's words from the recording. Independent sources are dated, and everything published after February 2015 is marked as later.

ClaimIn the talkIndependent recordStatus
Most candidates in one seatModakurichi, 1996: 1,033 11:05ECI FAQ: 1,033, booklet ballotConfirmed
88 zero-vote candidates88 11:37DT Next 2016 (later): 88; also 158 with one voteCorroborated
A farmers' protestYes; “500 bucks”, “5,000 people” 11:51TNIE 2021, TNIE 2026 (later): protest confirmed, details differProtest confirmed; amounts not
Priya Krishna's wealth“about 767 crores”, 2013 context 01:34MyNeta: 2009 movable ₹766.7 cr (total ₹770.6 cr); 2013 ₹911 cr; liabilities ₹734 / ₹778 crMatches the graphic's older data
Nilekani's assets₹7,700 crore 03:11NDTV, Mar 2014Confirmed
Two activists' cases382 and 380 04:07ADR 2014: declared, pending; anti-nuclear activistsConfirmed not convictions
Doordarshi Party97 / 298 / 321 candidates, 0 seats 07:21ET/Gramener 2014 agrees; Wikipedia says 288 for 19891989 count conflicts
Doordarshi candidate rulesteetotal, non-smoking, vegetarian, “bachelors… celibate, I'm not sure” 08:14Gramener story: teetotallers and vegetariansPartly; bachelors unverified
Nine-vote wins1998 and 1999 05:42Talk slide: Bihar 1998, AP 1989Speech vs slide
Uncontested, all-women, 99-year-oldnone since 1989; Karur & Panskura; 99 06:03Talk slide onlyAs presented
Faridabad bellwetheralways voted with the national leader, incl. 2014 09:09Talk slide: 11/11, 1977–2009As presented
Tamil Nadu 10 / 90 / 250Perambalur, Madurantakam (as heard), Pallipattu & Aravakurichi 10:01Not checked against returnsAs presented
Mahasamund namesakes“11 Chandulal Sahus” 12:17HT 2014: 10 namesakes (Chandulal and Chanduram); planting alleged, deniedNames vary; intent unproven

Transcript

Open full size ↗