Talks · S Anand
ED5518 · 4 Nov 2026
ED5518 Data Visualization · IIT Madras

What changed your mind?

An 81-minute class run as a live lab. Students wrote down how they would test a visualization, argued with their neighbours, and wrote again. They guessed which charts a stranger would understand, then swapped phones to test each other’s sensor apps. This page is the study guide: the ideas, the evidence, and what 24 students’ answers revealed.

Wed 4 Nov 2026, 2:00 pm IST Dept. of Engineering Design, IIT Madras Anand S, in Dr Palaniappan Ramu’s course
Listen to the class (81 min)Read the transcript · download audio

Earlier in this series: Why are you even sitting in this class? (12 Aug) · Looks right. Isn’t. (7 Oct). Tap any marker below to hear that moment.

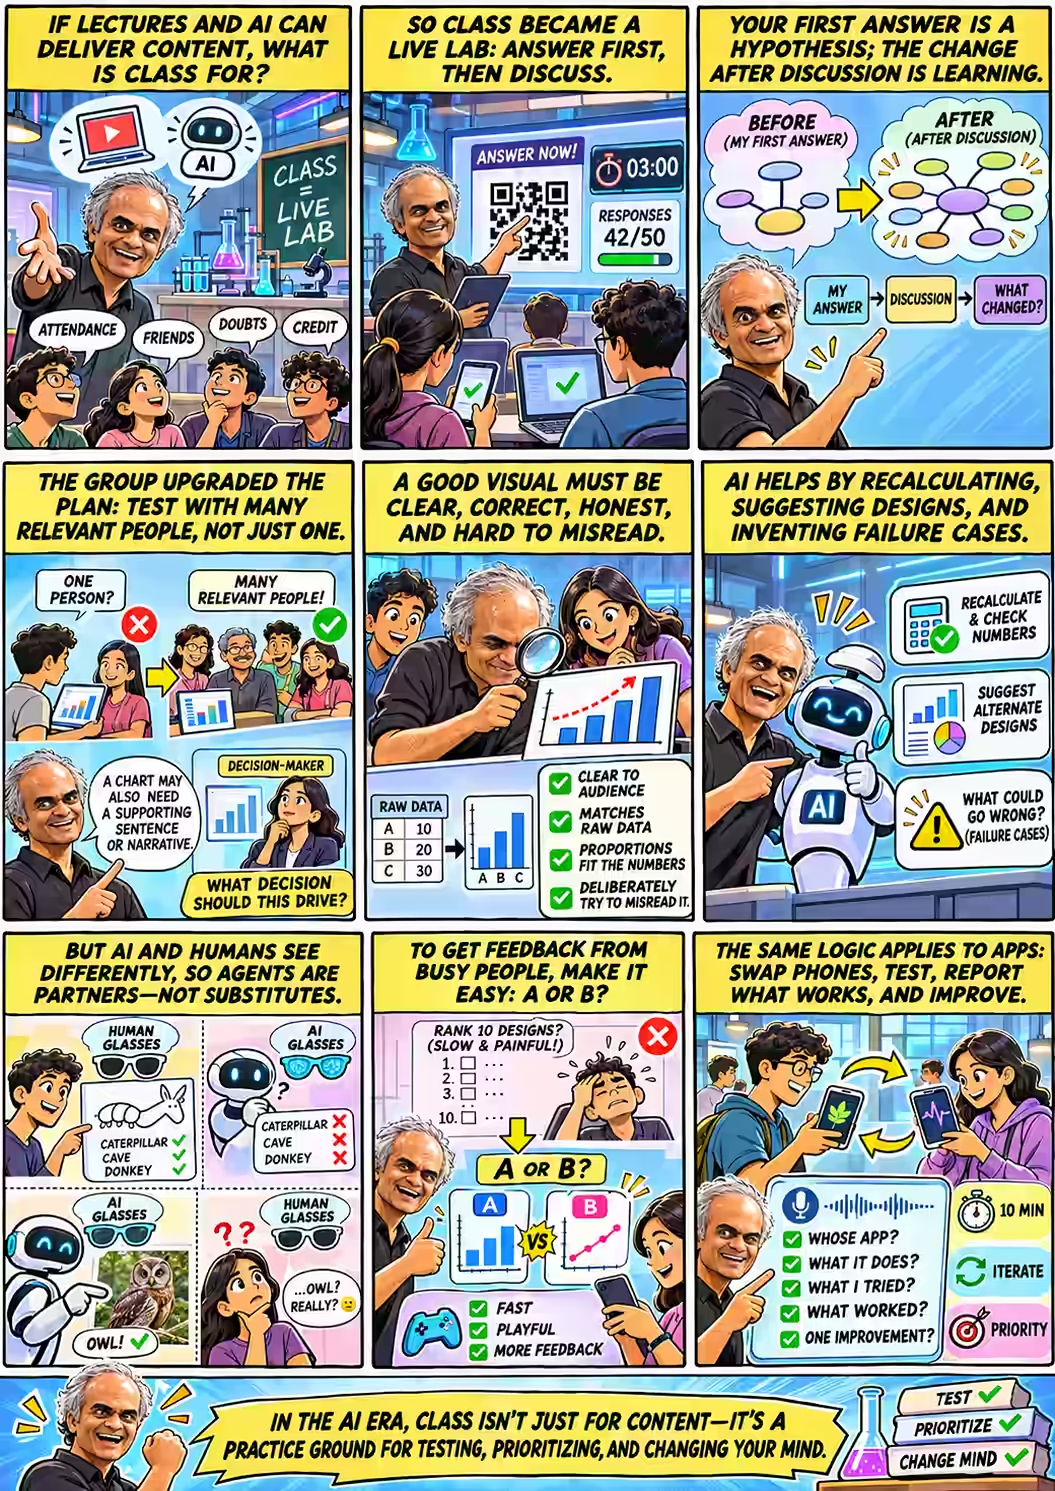
Nine-panel comic. 1: If lectures and AI can deliver content, what is class for? Students say attendance, friends, doubts, credit. 2: So class became a live lab: answer first, then discuss — a QR code, a 3:00 timer, 42/50 responses. 3: Your first answer is a hypothesis; the change after discussion is learning — before and after mind maps. 4: The group upgraded the plan: test with many relevant people, not just one; a chart may also need a supporting sentence; what decision should this drive? 5: A good visual must be clear, correct, honest and hard to misread — raw data checked against bars. 6: AI helps by recalculating, suggesting designs and inventing failure cases. 7: But AI and humans see differently — humans see caterpillar, cave, donkey; AI sees an owl humans cannot. 8: To get feedback from busy people, make it easy: A or B, not rank 10 designs — fast, playful, more feedback. 9: The same logic applies to apps: swap phones, test, report whose app, what it does, what you tried, what worked, one improvement. Footer: In the AI era, class isn't just for content — it's a practice ground for testing, prioritizing, and changing your mind.
The class as a comic page (AI-generated from the transcript; an interpretation, not a record). Tap to enlarge.
Opening

Why are you even here?

While latecomers trickled in, Anand ran a show of hands. Startup right after college? Higher studies? A job? Most of the room wanted to work. The last time he had asked a batch this, in 2010, it was a larger class of chemical engineers, three of them planned a startup, and the majority were planning to study right after. 01:21 Why work? Finance, said one student. Wouldn’t an extra degree pay more over a career? The nods said it wasn’t about lifetime return. It was about cash flow now.

Then, at two o’clock, the real question, one that hangs over every class in the age of AI: Why do you bother attending classes? You can get this from a lecture online. 04:13

Palani got the first laugh: Well, it’s good that you’re asking the question towards the end of the course. The students gave real answers. Attendance. Credit, though a classmate pointed out that there are people who don’t attend the class, but they come and write the exam. Reading is boring. Doubt clearance, which Anand answered in four words: Which you can ask AI. 05:42 And the most honest one:

“This is like a dedicated slot so that we will come here and listen. But if I want to do that in my room, it’s like it won’t happen.”

— A student, on why class still matters 05:04

Someone said they come to meet friends. In which case, you should be talking to them, not staring at me. 05:50 Anand then admitted something teachers rarely say aloud:

“See, the education system is designed more for teachers, perhaps, than for students.”

— Anand 05:50

Having everyone pay attention to one speaker and take the same test is convenient for the teacher. Content is the one thing a classroom no longer has a monopoly on. A room full of people can do other things, though. They can commit to an answer without seeing anyone else’s. They can argue face to face. Most usefully for a course on visualization, they can be each other’s test audience. So: since you are here, and AI is anyway eating up our lives, why don’t we do something slightly different today? 05:50

That design didn’t come out of nowhere. That morning, Anand had asked ChatGPT to scan the possibilities:

Anand’s prompt, the morning of class

What are ways by which we could explore ways of teaching that can leverage my physical presence and synchronous presence in a way that offline and asynchronous cannot? Based on that, for this particular course, what could we do that is powerful and interesting?

ChatGPT, in part
Rather than another talk or live-coding demonstration, make the students simultaneously designers, experimental subjects, skeptical customers, and investigators. … An AI can generate a beautiful visualization. Only testing it against reality and unfamiliar people tells us whether it works.

The class kept that skeleton and dropped the props: predict privately, discuss, revise; then test charts on each other, then test apps on each other. Everything ran through a live form on Anand’s laptop. The form’s title was the agenda: Verify, compare, test.

Housekeeping from class

Anand had seen 32 submissions for the visualization assignment and 31 for the mobile app, from a class of about 48. If yours is missing, check that it is where it should be and that he can open it. On access: I’m not going to give you my email ID. This much you should be able to do with Google. 07:00 An AI agent will do the first pass of grading, and it is just very happily going to give you a zero 08:15 for anything it can’t open.

Act I · Commit first

Your first answer is a hypothesis

The students had already built a visualization for Varuna, the factory dataset from earlier homework, and revised it into a replay aimed at a manager’s decision. Now someone had to grade it: Anand, his agent, and Palani. How should we evaluate it is the point of discussion. 08:45 Before any discussion, though, each student answered one question alone, on their phone:

Question 1 · answer alone, locked after submitting

You have created a visualization. How would you test whether it is correct and whether it achieves its intended purpose for its intended audience?

Describe the specific checks or experiments you would run, what evidence you would collect, and what findings would make you revise or reject it.

Then came the wait. Six responses in four minutes. Ten. Seventeen. Nineteen. Anand watched the counter crawl and said what every teacher thinks:

“Some guys get it; there’s no point teaching them. Some don’t; there’s no point teaching them. What do we do with the middle?”

— Anand, waiting for the counter to reach 25 17:44

Why write first and talk later? Because of something Anand noticed in ninth or tenth standard. He would read a book, it would make perfect sense, and he would conclude he had learned nothing: Something makes perfect sense when you read it, and I started assuming therefore that I knew it beforehand. 18:43 If someone had asked him before he read it, he would probably have given a different answer, or said he had no clue. Psychologists call this hindsight bias. Its classroom cousin is the illusion of explanatory depth.

The core method of this class

“Put a hypothesis on the table … see what is the difference between that and what I have learned. At least that difference now constitutes net learning.”

Anand, on why the answers were locked once submitted 18:43

Write first, then discuss, then write again. Educators call this peer instruction. Committing to an answer before you see the explanation is a form of the testing effect, and a meta-analysis of 225 STEM studies found that active classes like this one beat lectures. The written first answer matters because you can’t measure how much you moved if you never recorded where you started.

Try it yourself before reading on

Take a chart you made recently. In three lines, write how you would prove that it is correct and that it works for the person it is meant for. Keep the note. By the end of this page you will have something to compare it with, which is the whole point.

Act I · Commit first

Half a test, twice over

Twenty-four students answered. Read their answers side by side and they split into two families. One family asks “Is it true?” Do the numbers match the raw data, are the axes and labels honest? The other asks “Does it work?” Can a real person look at it and get the message? Each family was well represented. Few answers had both.

What students proposed, before any discussionof 24
Show it to people and see what they understand13
Check it against the raw data or ground truth12
Did both5
Use AI agents as the audience or the checker2
Compare it against a simpler baseline, like a plain table1
Check that shapes are proportional to the numbers1
Deliberately try to misread it1
Say in advance what result would count as failure0
Hand-coded from the 24 first answers to Question 1; an answer can fall in several rows. The rare ideas are the valuable ones.

The common answer was a good start. Ask friends to skim through the visualization and tell insights they get from it, then compare it with our objective, wrote one student. Another: Find people who have no prior knowledge about thr data. Then show them the visualization and ask them to interpret it. Neither is wrong. The trouble is what neither one checks. Showing a chart to people tests whether the message gets across. It doesn’t test whether the message is true. Checking the data tests whether it is true, not whether anyone can read it.

The rare answers had the ideas that make a test strong. Four of them deserve a closer look:

Baseline + rejection rule

“I’d first check the numbers myself, recalculating them from the raw data … Then I’d show it to 5-8 people from the real audience, ask what they take away with no hints from me, and compare how they do against a plain table. If the numbers are off, people misread it, or the table works just as well, I’d rework it or scrap it.”

The most complete answer. It does both halves, uses real audience members, gives no hints, and compares the chart with the simplest alternative. It even says what would make the student throw the chart away.

Encoding, not just values

“Compare the aggregated values shown in the visualization directly against actual data / Verify that geometric proportions (e.g., bar lengths) scale correctly with the data values”

A chart can print the right numbers and still draw them wrong. Think of a truncated axis, or a bubble scaled by radius instead of area. Tufte called the size of that distortion the lie factor.

Attack your own chart

“Thinking of ways to misrepresent my own visualisation, to have a sense of how easy it is to misinterpret the intended purpose”

This is red-teaming. Instead of asking “do they get it?”, ask “how could a reasonable person get it wrong?”

Cold read, then warm read

“I would then ask a few friends to go through it without giving them any background context … After that, I would explain the context … and then check if their interpretation or opinion changes.”

This separates what the chart says on its own from what your explanation adds. In real life, you won’t be standing next to your chart to explain it.

The empty last row of the chart is the gap the rest of the class kept returning to. No one said what result would count as a failure before running the test. “If they understand it, it works” sounds like a test. Without a threshold it can’t fail, so it isn’t one. A real test sounds like this: “Shown the chart for 20 seconds, at least four of five plant managers pick the right station to fix.” (The four-of-five is an illustration, not a standard. The point is that you write it down before you look.)

Act I · Commit first

“If people agree, the visualization works”

Anand read that line from one of the answers to the room. Makes sense. Any problem with that, though? 30:05 The class took it apart in three moves.

First, agreeing isn’t the same as understanding. Second, from a student who had clearly been thinking about it: everyone understands, but what if … it doesn’t clearly answer the question? … have the facts from the data been taken properly, right? 30:42 And third, the sharpest point in the hour:

“There is a common mode, right? Like you might be asking all the people of same group. So, they might be blind to it.”

— A student 31:06

Common mode is a reliability engineer’s idea, and it fits here exactly. Five classmates who share your background, your course and your assumptions are not five independent checks. They are one check repeated five times. Anand split the fix in two. Part A: ask enough people, and the right people. Part B: make sure you are showing them the right thing.

“If I show a graph which says men live longer, women live less, and everyone agrees on the same interpretation, except that, in truth, the reverse is the case, chart is just plain wrong.”

— Anand 31:22

He then praised the rare answers by name. Recalculating from the raw data. Checking geometric proportions: it’s one thing to say, “I have written 24 and 25 here.” It’s another thing to show that difference as 3x, 4x, which absolutely is unwarranted. 31:45 And deliberately looking for ways to misread the chart: That’s powerful. 32:26 Searching for misreadings also protects against the common-mode problem, because somebody who we don’t even know might be looking at it in a different way.

People get the intended message
People misread it
The data is right
Ship itTrue and understood. Rarer than it looks; prove both.
RedesignHonest numbers nobody can use. Most “data-correct” charts land here.
The data is wrong
DangerEveryone confidently agrees with a falsehood. “People agree” cannot catch this.
Scrap itWrong and confusing. At least nobody acts on it.

Two independent tests. Audience testing tells you which column you are in. Only checking against the data tells you which row.

Act II · Who’s looking?

The owl nobody saw

A few answers suggested a shortcut: skip the people and test the chart on an AI audience. One proposed creating some ai agents as a audience lets say some roles like project manager, employee etc. Another laid out a six-step pipeline of independent agents checking each other, with a human deciding at the end. Anand’s verdict: This is both good and bad. 32:57

The good part: an AI can play roles you can’t easily recruit for. You can ask it to take the personality of some extremist who is looking at the data trying to misinterpret it. That is red-teaming on demand. The bad part is a question nobody had asked: does an AI even see the way your audience does? And it is crazy. Let me show you this.

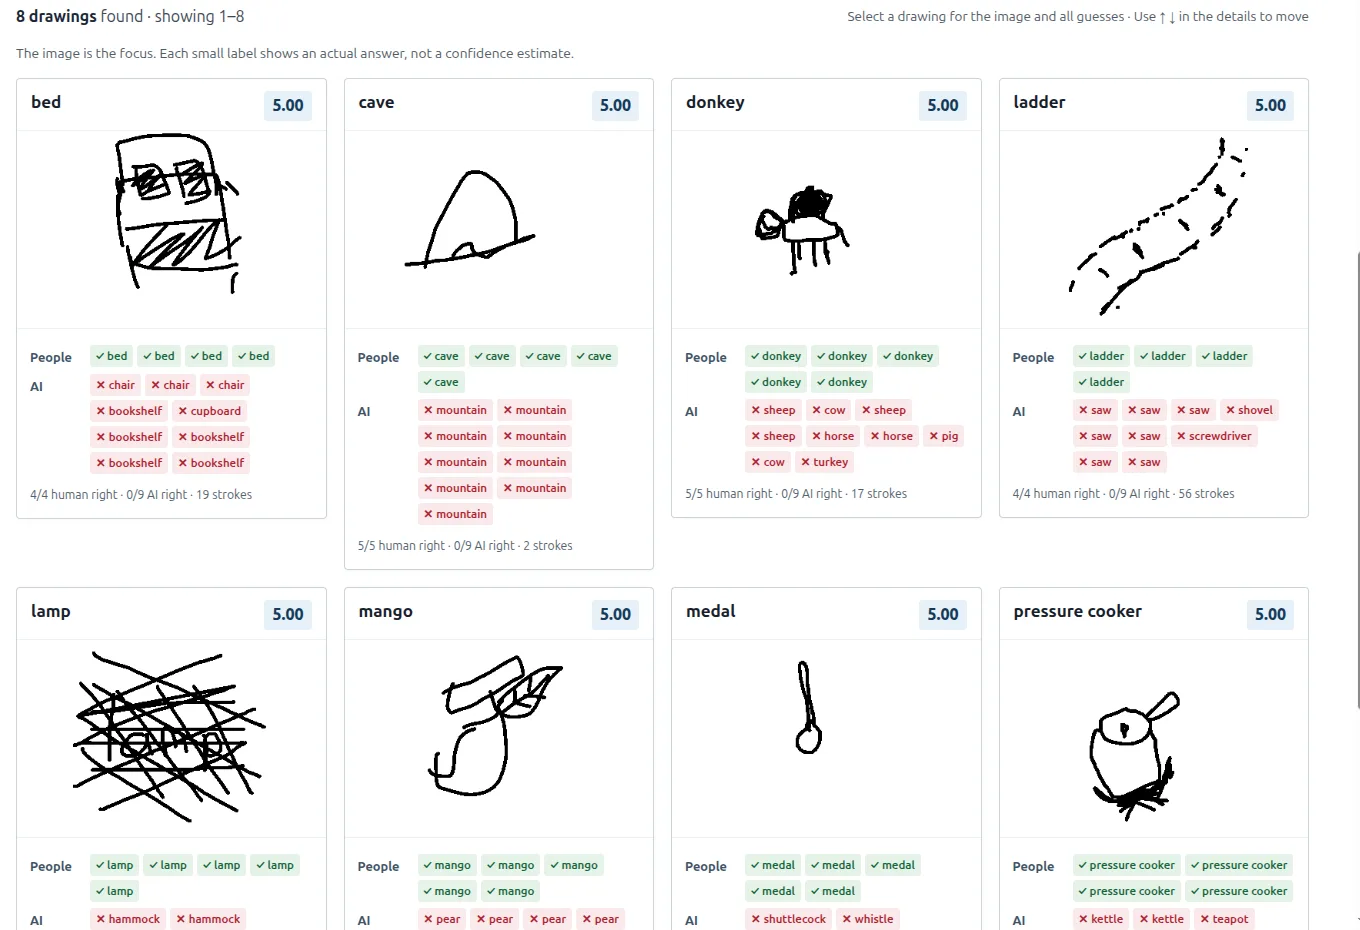
He switched screens to a results page from his other course, Tools in Data Science. Students there had each drawn objects in a minute. Other students, and three AI model families, then tried to name each drawing from ten options.

Humans Only · 866 drawings · 4,186 human guesses · 7,794 AI guesses

Every human saw it. No AI did. And the reverse.

From the anonymised Humans Only results page that Anand showed in class. Green labels are correct guesses, red are wrong; each AI model family made three attempts.

Grid of eight sketches where every human guessed right and all nine AI guesses were wrong: bed (AI said chair, bookshelf), cave (AI said mountain nine times), donkey (AI said sheep, cow, horse, pig, turkey), ladder (AI said saw), lamp (AI said hammock), mango (AI said pear), medal (AI said shuttlecock, whistle), pressure cooker (AI said kettle, teapot).
The eight drawings where every human was right and all nine AI attempts were wrong. A two-stroke cave was mountain nine times out of nine. The donkey became a sheep, a cow, a horse, a pig and a turkey. Open this filter ↗
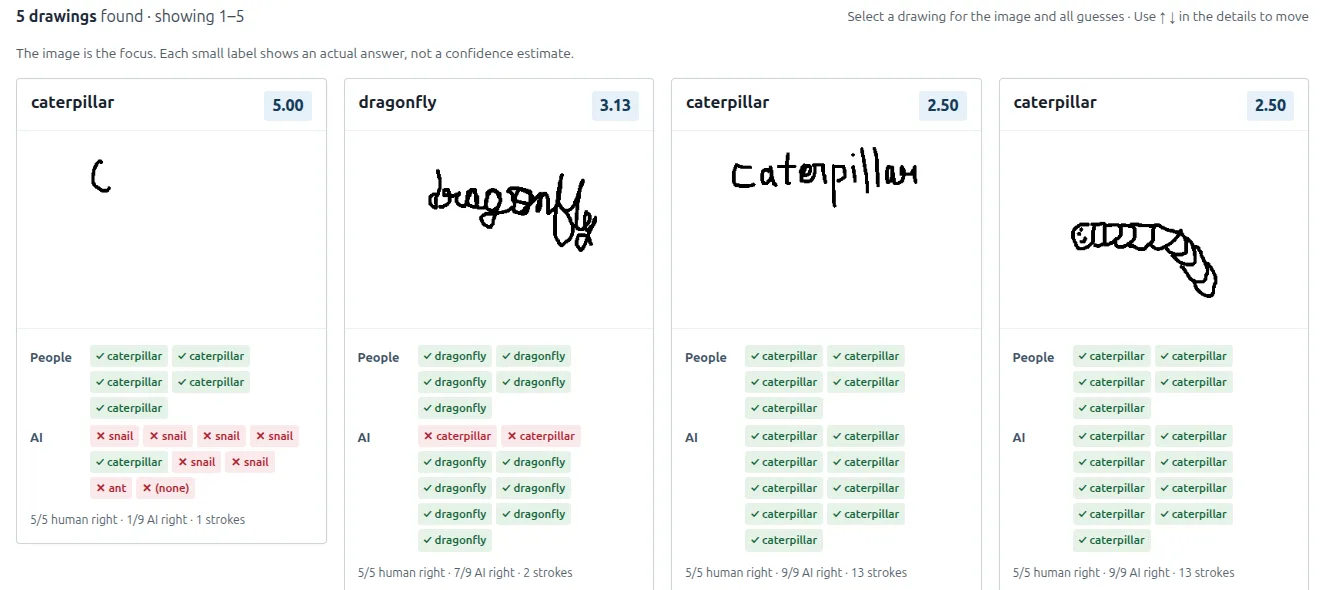
Caterpillar search results. A single stroke 'C' scored 5 of 5 humans right but only 1 of 9 AI (mostly 'snail'). Other entries spell the word out, which AI reads easily.
A single C for caterpillar. Five of five humans got it; the AI mostly said snail. Notice the drawings that simply write the word: the AI reads those perfectly. Open ↗
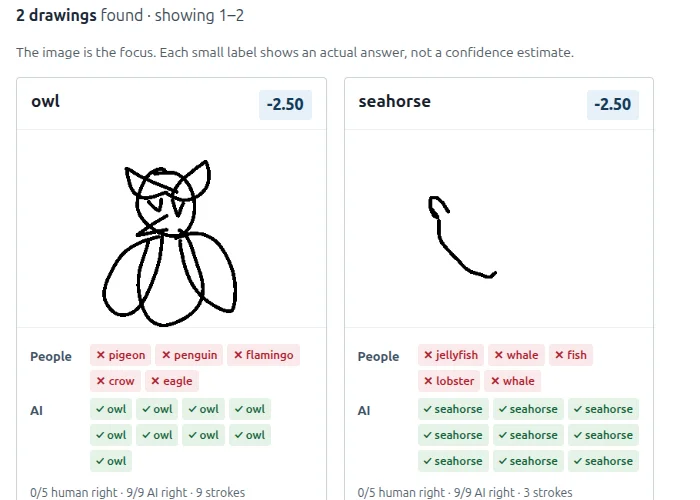
Two drawings where no human was right and all AI were right: an owl (humans said pigeon, penguin, flamingo, crow, eagle) and a three-stroke seahorse (humans said jellyfish, whale, fish, lobster).
The reverse. Humans guessed pigeon, penguin, flamingo, crow and eagle. None of the models had even the slightest doubt that this is an owl. Yeah, I can’t see the owl. 34:51 Open ↗

The conclusion is plain: an agent has a very different kind of perception. 35:14 And if they perceive differently, they make different mistakes. They have far more patience: They will check, double check, triple check, quadruple check. What human does that? Yet they also stumble where no human would: And what human can’t count the number of R’s in “strawberry” if they know English?

“Don’t use agents as a full substitute for humans.”

— Anand 35:39

Put this next to the common-mode problem and a useful idea falls out. An AI reviewer is valuable precisely because it fails differently from you. It is a check whose blind spots don’t overlap with your friends’ blind spots. That makes it a good additional reviewer. It makes it a bad stand-in for your audience. If GPT reads your chart perfectly, you have learned something about GPT. You haven’t learned much about the plant manager. Anand’s write-up of the experiment, Drawing humans-only CAPTCHAs, goes further into what kinds of drawing fool which kinds of eye.

Explore it yourself: filter by “AI model families disagree” or “Everyone chose the same wrong word”. Open the full results page in a new tab ↗
Act III · What changed

“I’m very patient”

The second question was the first one turned back on the student. Eight minutes of talking with neighbours, then a new box on the same form:

Question 2 · after discussing

Discuss with your neighbours. What have you changed your mind on?

Not changing your mind was allowed. Anand asked only that you notice the difference: Have you changed your opinion on anything from the previous answer you gave? 25:38

When he asked the room to share, there was a silence. Anyone wants to share something that you felt, “Okay, I thought X before, now I think Y” … ? I’m very patient. 36:11 Then three students spoke, and each named a different kind of change.

2 → 7answers mentioning AI, before vs after discussion. AI became the topic at the tables.
1 → 3answers about deliberately misreading or sabotaging the chart. One student’s idea spread.
4students said plainly that they hadn’t changed their mind. That’s allowed, and honest.
0 → 0answers saying what result would count as failure. Discussion added techniques, not pass/fail criteria.

Hand-coded from 24 students’ first and second answers, matched by student.

From one opinion to the decision that matters

The first student had planned to show the chart to someone from the domain. Discussion changed that: it is better to show to the multiple, you know, such affected people and they will give their different opinion, and then maybe we can kind of decide upon which is that parameter which actually drives them to take the decision. 37:03 Anand summed it up: show it to many, not a few, and ask specifically about the parameter that drives the decision. That’s a powerful one. This moves the test upstream. Before you check whether the chart delivers its message, check that the message answers the question the decision-maker actually has.

A chart may need a sentence

The second student had arrived thinking a graph is enough and left with this: I think just the graph is not enough. 38:38 In other words, a narrative line is part of the visualization. Another wrote on the form, I will add my final conclusion in addition to the visualization where the graph is an evidence. That is good practice, with one trap: a headline can prime readers to agree. So test the chart with and without the sentence. If people only “get it” when told the answer, the chart is not doing the work.

One visualization is a step, not a destination

The third student started with validating against labelled data and ended up somewhere bigger: Visualization is a iterative one until the required information passed to the audience. 39:01 Anand ran with it: a good visualization is one that leads to more questions.

“If somebody looks at the visualization, says, ‘Ah, okay, but,’ and moves on to another topic, you’ve done a fantastic job. It feels terrible, by the way.”

— Anand, on why the best charts create more work for you 39:40

It feels terrible because you put in a lot of sweat, they glance at it, and now they want three more charts. But that is what success looks like. The chart didn’t get in the way. The reader understood it, believed it, and moved on to the next question in their decision.

“I used to think correct results were enough, but now I understand that testing also means checking whether the system achieves its intended purpose reliably.”
The clearest shift: from true to true and useful
“So first we should check the visualization against the data before ai agents are writing their opinions.”
An AI-first plan, corrected by its own author
“No changes in the discussion, everyone thought same just one smart friend told to think how can I interpret this chart wrong”
“No change”, followed by the best idea at the table
“Can give the whole visualisation to a llm and ask it to wantedly misinterpret or try to derive misinterpretations”
Red-teaming, delegated to AI
“Then ask an AI agent to also generate a visualisation based on the same context that I have. Then we can involve the audience to compare the two visualisations”
A/B testing against an AI rival, before class reached A/B
“May be i shouldnt ask gpt..”
The shortest answer in the set

Then Anand pointed out what the answer counter had shown. The first question was far easier for the class than the second. Answers to “How would you test a visualization?” came quickly. Answers to “What did five minutes of discussion change?” came slowly, and they were short.

“The first question you can ask an AI and get the answer to. Second question is how you are changing yourself.”

— Anand 40:26

Here is the skill he meant: I have a point of view. I know my point of view. Somebody else has a point of view. I am able to listen to that point of view, and I am able to find out the difference … and adjust mine accordingly, or choose not to adjust mine accordingly. 41:02 It is also what wins group discussions, in MBA interviews and in meetings: keep track of where you agree and disagree, distill it, and fold it into your view.

Act III · What changed

The question nobody discussed

The second signal was an absence. None of the discussions have anything that would tell me what would make a visualization fail. 41:50 One student had written about deliberate misreading in their first answer. The groups never took the idea up together. Adversarial testing was the class’s collective blind spot.

Who does think this way by default? Journalists would. Journalists would think almost exactly about how would this chart be misinterpreted. A journalistic editor, in particular. 42:27 And the cost of not thinking that way:

“All of you, when you produce visualizations, you will assume that your result is correct and will get tripped up maybe 5% of the time, but you are likely to get tripped up. Just be aware of that.”

— Anand 42:27

He read on from his notes, an AI summary of the answers that had come in minutes earlier, and added with a straight face: I’m not projecting. I’m just reading my notes. 43:53 Taken together, the class had found three jobs for AI in testing a chart, and probably no single student had thought of all three at the start:

Generate failure cases

Ask it to misread the chart on purpose, as a sceptic, an extremist, a hurried manager. It can think differently.

Recalculate independently

Give it the source data, not your chart, and see if it reaches the same numbers. That checks the row of the matrix above.

Propose alternative designs

Use it as a design partner. Each alternative becomes the B in an A/B test of your chart.

Note what is not on the list: standing in for the audience. The owl took care of that.

Then Anand announced how grading would work. The class’s collected answers would become the rubric, and he would apply it to their Varuna visualizations, as a human and with AI. Let’s evaluate it against all of these criteria that you have laid out, and see what the gaps are between your collective knowledge versus that. 45:00 The students had, without knowing it, written their own marking scheme.

Exercise: write a test that could fail your chart
  1. Claim. One sentence: what should a reader conclude? (“Station 30 is the real bottleneck.”)
  2. Truth check. Recompute that conclusion from the raw data, ideally by someone (or something) that hasn’t seen your chart.
  3. Task. Pick who reads it (the intended audience, not your friends), how long they see it, and what question they answer. (“Which station would you invest in?”)
  4. Threshold, written before you test. (“At least 4 of 5 choose ST30 in 20 seconds without help.”)
  5. Attack. Name the most likely wrong conclusion, and check whether anyone reaches it.
  6. Baseline. Run the same task with a plain table. If the table does as well, what is the chart for?
Act III · What changed

“When do I stop?”

A student raised a real worry. On an unfamiliar, multi-domain dataset, AI largely drives what we make out of the data. And people fixate: when we get the first, you know, clue of somewhere something is wrong, we generally tend to stop there. 45:26 They give an undue weightage to only that first flaw instead of collecting every fault, relating them, and ranking them. Radiologists know this trap well. Once you find one fracture, you are less likely to spot the second. It is a cousin of anchoring. Under that worry was a bigger question: how much of time are we supposed to spend on a particular visualization is an open-ended question.

Anand restated it the way every working engineer has felt it:

“Boss, I start solving a problem, I can solve it to death. When do I stop?”

— Anand, restating a student’s question 46:44

The class answered it themselves, one rule at a time.

  1. Deadline“If I have 2 days to do it and I can only spare a day out of it, so I sit a day, do it for half a day with half a day of rest, and whatever comes, then I just send it.” 46:56
  2. PrioritiseTen problems don’t each get a tenth of the time. The most important get most of it. Priority, exactly. 47:26
  3. Threshold“Does the visualization at least do the bare minimum part? It has to catch one fault.” Below the bar, keep going; above it, it’s just a bonus. 47:58
  4. Build capacitySpend some time getting faster for next time: maybe 10% faster, 50% faster, 20% more effective. 49:01

The fourth rule is why the course exists. What we’re doing in this class really is … investing a certain amount of time to say, “At some point, something will go to the back of my head.” 49:27 And the effort itself is the point: the harder your brain works at that point, the deeper it sticks, the quicker it comes back. 49:51 Learning scientists call this a desirable difficulty. It is also a fair warning about letting AI do the thinking for you.

A last student named the real constraint: feedback. If I’m actually creating a visualization for someone like a manager-level who has to take a decision, how much of the bandwidth do I get with that manager to take any feedback? 50:29 Anand agreed, and gave the two reasons busy people refuse: One: you take too much time. Two: it is- I don’t see the point. 50:56 The next exercise was built to answer the first one.

Act IV · Feedback, fast

A or B, in ten seconds

Six charts came from Anand’s July workshop at VizChitra, The Curator’s Dilemma, where data-visualization practitioners voted on which they would sign their names to. Here they were paired off. Anand flashed each pair for about ten seconds, with no explanation: The screen flashes, flashes, don’t worry about it. 51:34

The wording of the question was chosen with care. When Anand asked ChatGPT to help draft it, it pushed back on “which is better?”:

ChatGPT, while designing the form

I’d recommend measuring predicted comprehension, rather than asking which is simply “better.” That’s a more precise question, and it gives you something you can subsequently test. … I would force an A/B choice, even when students think both are poor.

Questions 3–5 · the same wording for all three pairs

Imagine a student unfamiliar with either subject sees each visualization for just 10 seconds, without any explanation. Which visualization is more likely to help that student correctly understand its main message?

Start with A or B, then name the specific visual features behind your prediction.

Play along. For each pair, tap Show for 10 seconds, make your prediction, and then see how the class split and why. (Afterwards you can open any chart at full size.)

Pair 1The two crowd favourites
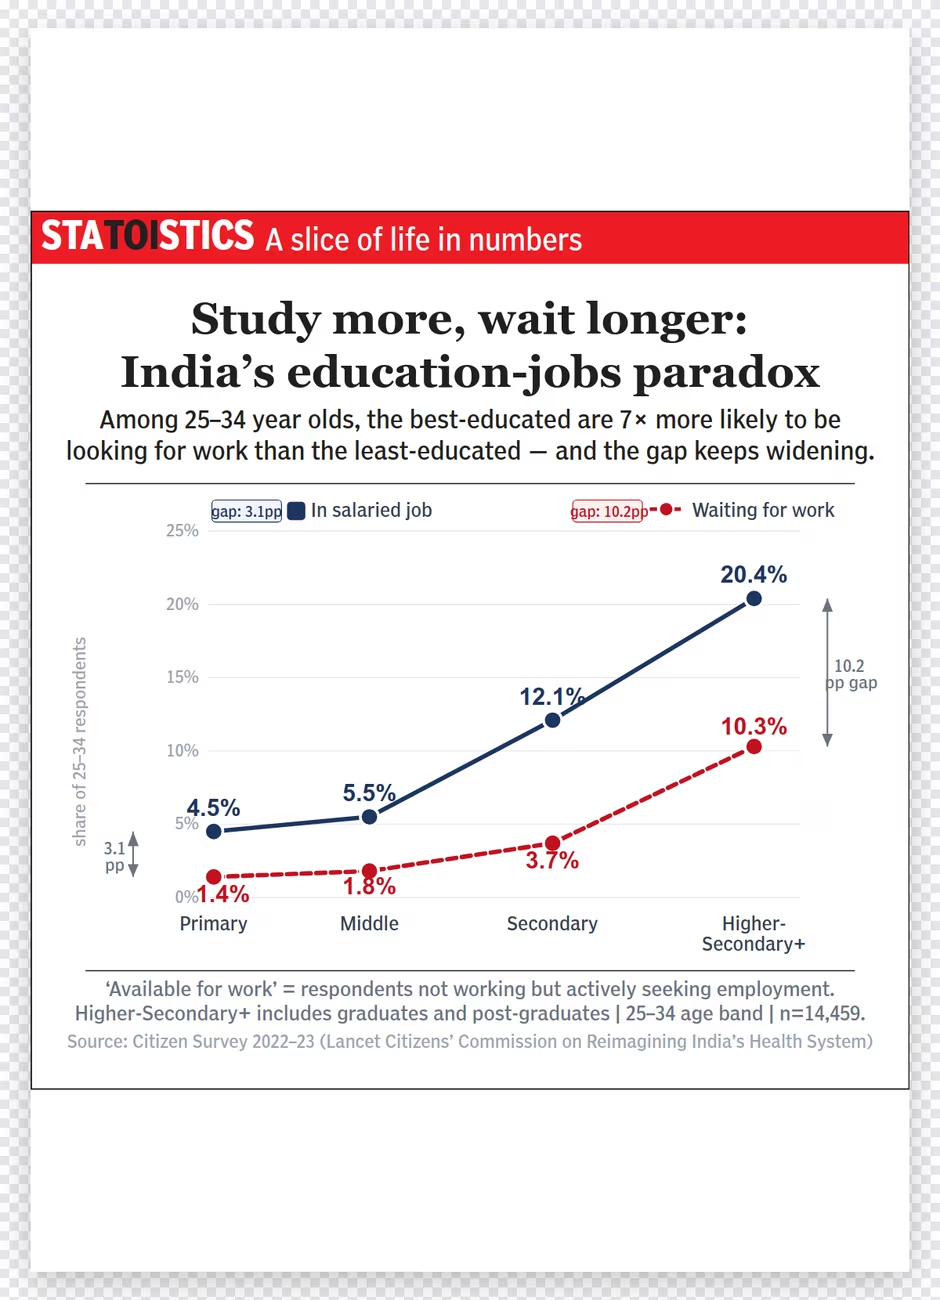
Statoistics poster: two lines across education levels, share of 25–34 year olds in salaried jobs and waiting for work; the gap widens to 10.2 percentage points for the most educated. Headline: Study more, wait longer: India's education-jobs paradox.
A · Statoistics
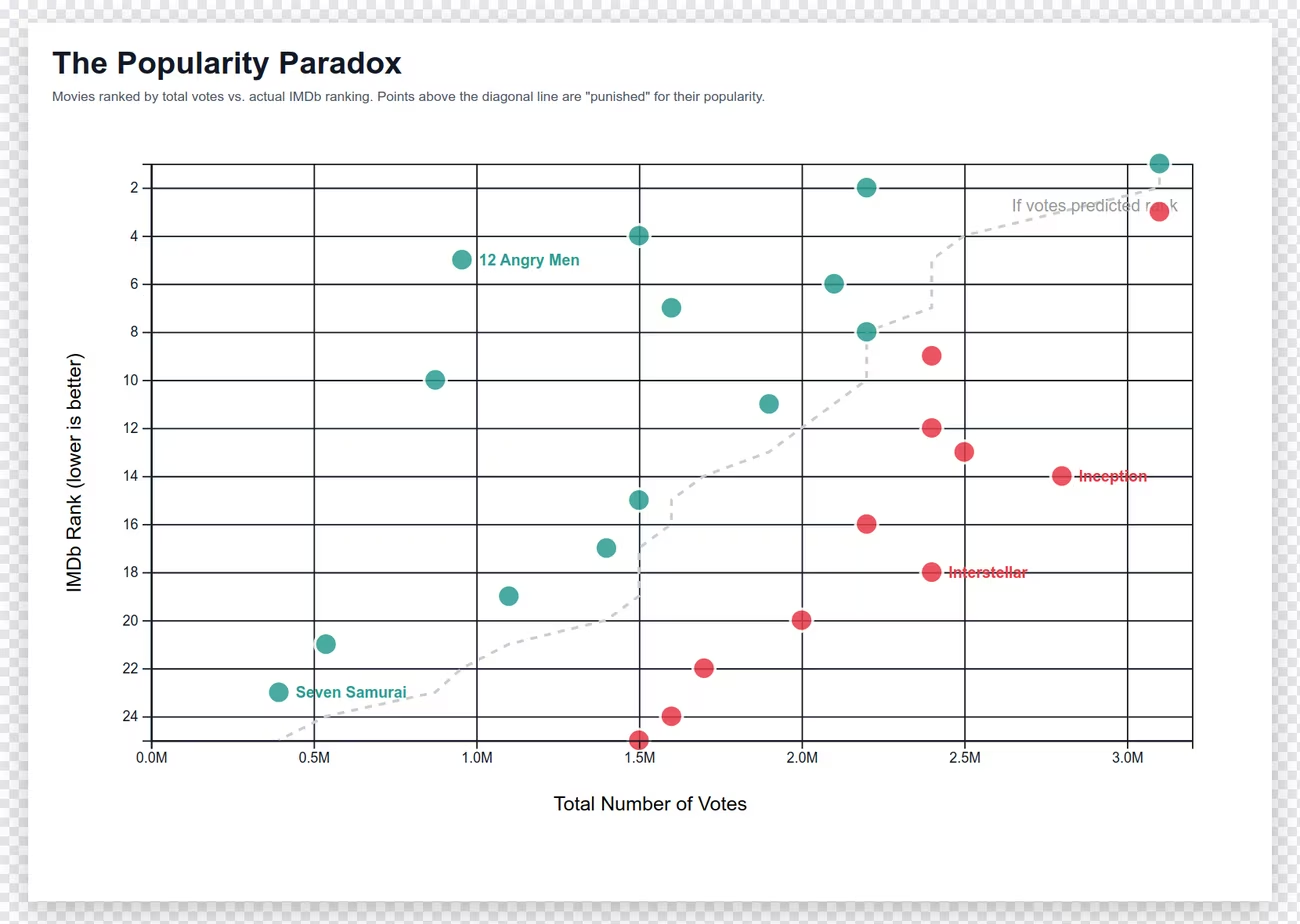
The Popularity Paradox: scatter of IMDb rank against total votes for top films.
B · Popularity Paradox
Your prediction:
Pair 2Different trade-offs
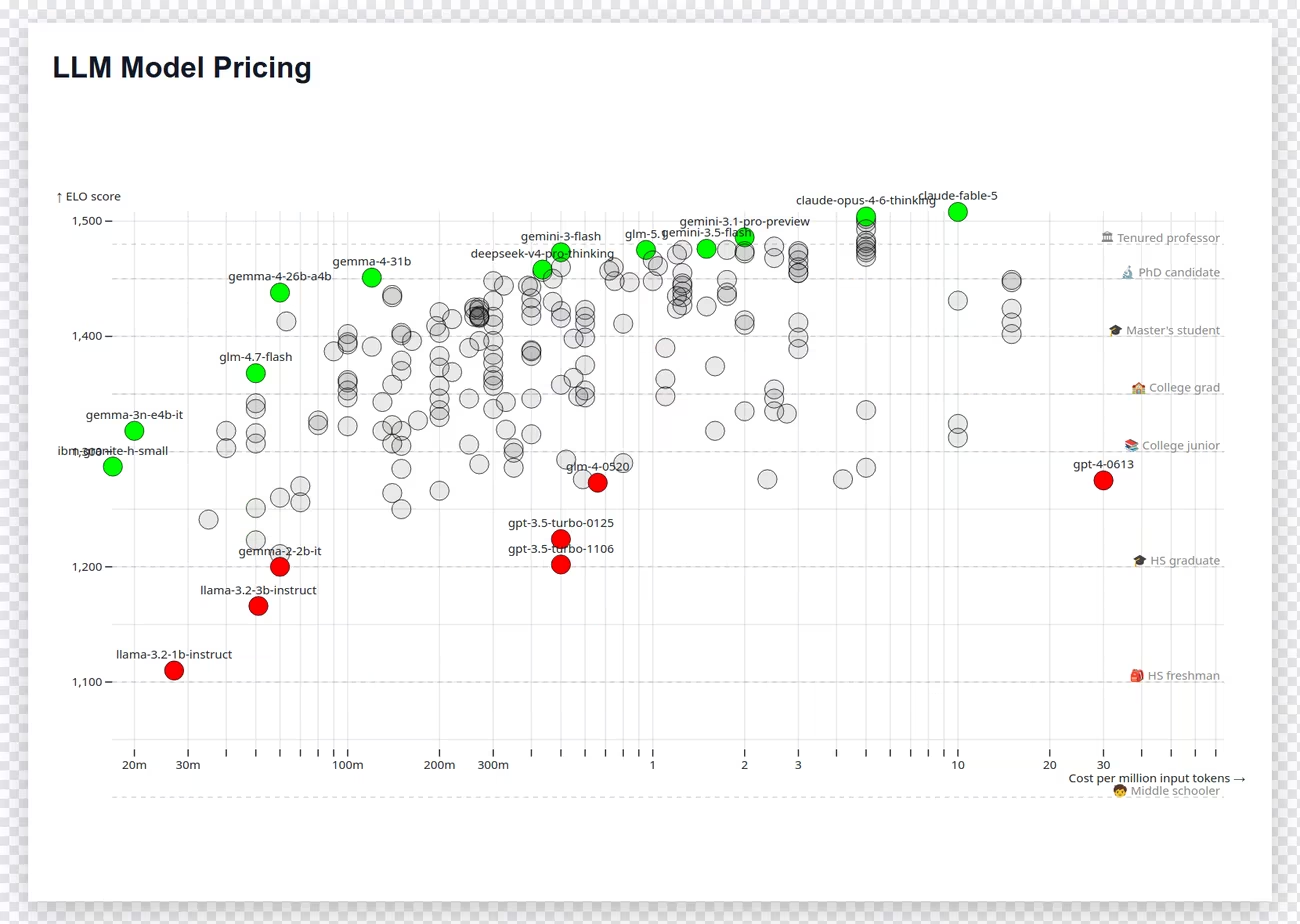
LLM Pricing: language models plotted by ELO score against cost per million tokens, with many labelled circles.
A · LLM Pricing
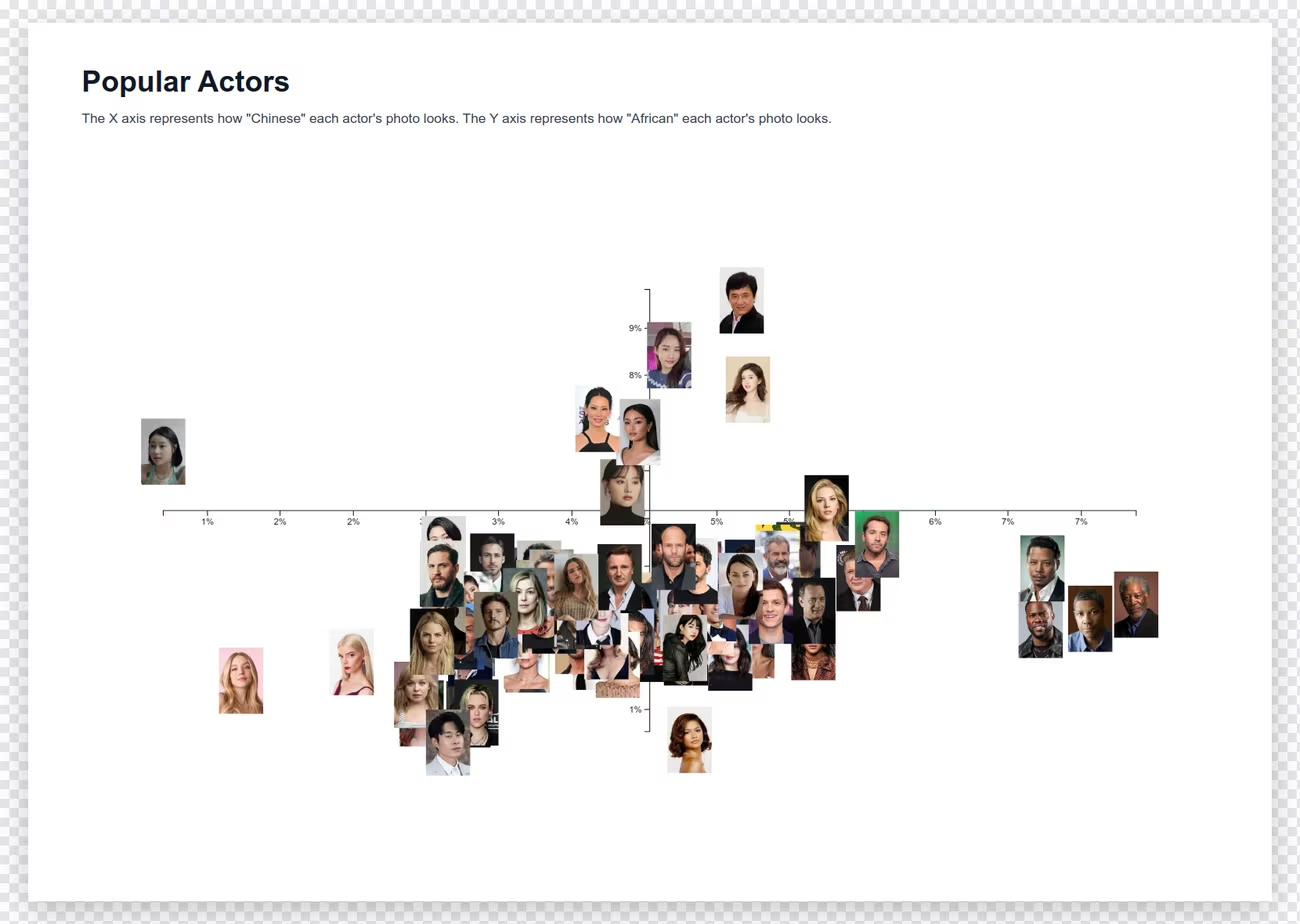
Popular Actors: a scatter of actor face photos placed by an image-embedding model along 'Chinese-ness' and 'African-ness' axes.
B · Popular Actors
Your prediction:
Pair 3Two complex charts
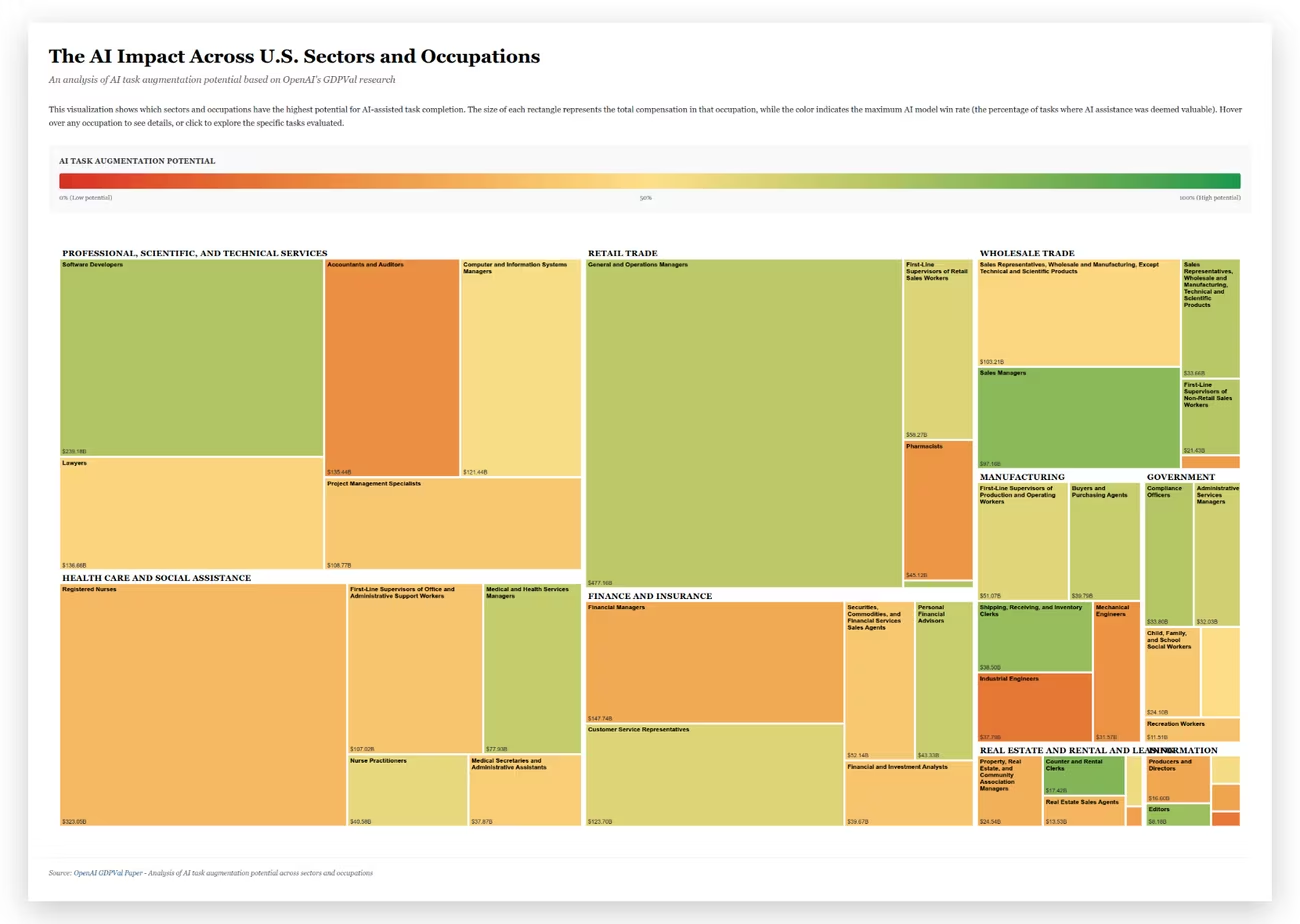
GDPVal treemap: rectangles for US occupations grouped by sector, coloured red to green by AI task-augmentation potential.
A · GDPVal
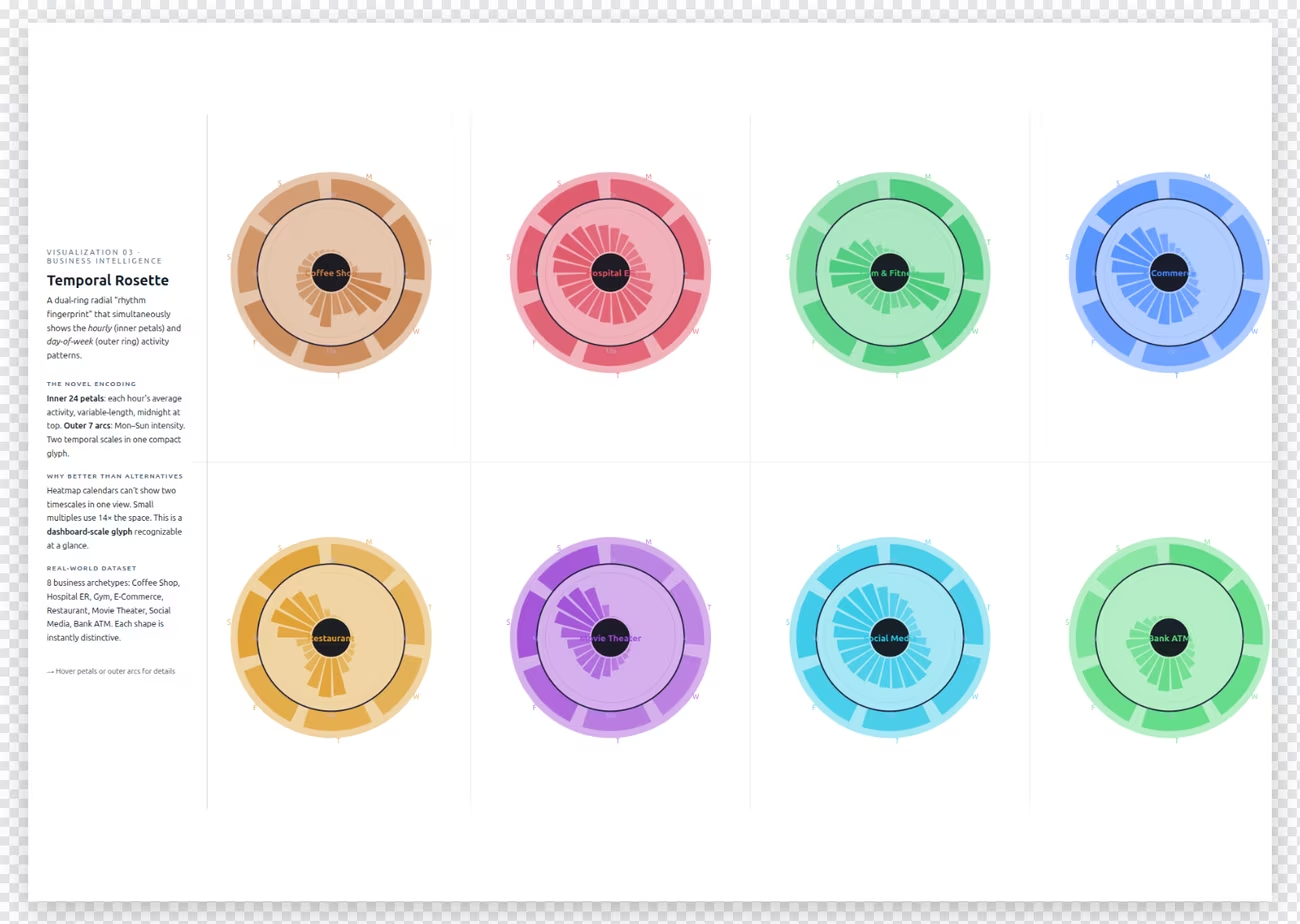
Temporal Rosette: eight dual-ring radial glyphs showing weekly activity rhythms.
B · Temporal Rosette
Your prediction:
Act IV · Feedback, fast

Same feature, opposite verdicts

The vote counts are the least interesting part of the result. The reasons are better. Students cited the very same feature as the reason a chart works and as the reason it fails.

Feature“It helps”“It hurts”
Explanatory text“A, title and sentence below that” Pair 1“B: Because it has very less text compared to A which makes it easier to interpret” Pair 1
The same text, on GDPVal“a has limited, precise text and easily understandable compared to B” Pair 3“Visualization A requires us to read through a huge block of text” Pair 3
Faces as data points“The faces have been given instead of just names.” Pair 2“B uses images to represent points and it becomes so clumsy” Pair 2
The axes“B is better, as the axes are clear and easy to understand.” Pair 2“B was misleading because in the X axis it was supposed to be how Chinese a actor looks, but that was presented in the y axis.” Pair 2

Two students looked at the same GDPVal treemap and disagreed about whether it had “limited, precise text” or “a huge block of text.” Neither is lying. They were reading different things, or reading at different speeds, or bringing different backgrounds. That is the point of testing on people: a feature has no fixed value. Its effect depends on the reader and the task. Faces help you recognise someone fast. They make precise comparison harder. Which matters depends on the job the chart is supposed to do.

Three more patterns are worth learning from:

Finally, remember what this exercise measured: predictions of comprehension. Nobody checked whether a novice actually understood the GDPVal chart in ten seconds. Measuring that would be the next experiment, and it would be easy to run.

Turn a preference into a measurement

Show GDPVal to three people who have never seen it, for 10 seconds. Ask them separately: (1) What do the colours mean? (2) What does the size of a rectangle mean? (3) Which three jobs should a company pilot AI on first? The first two test decoding. The third tests whether the chart supports its decision. It’s common to pass the first two and fail the third.

Act IV · Feedback, fast

Make it binary. Make it a game.

So, how do you get feedback from people who are busy and want to see impact? If I had to pick one mini, but very important lesson on gathering feedback from people who are busy and want to see clear impact, it is: make sure that it is a binary comparison. Do you want this or this? 61:38

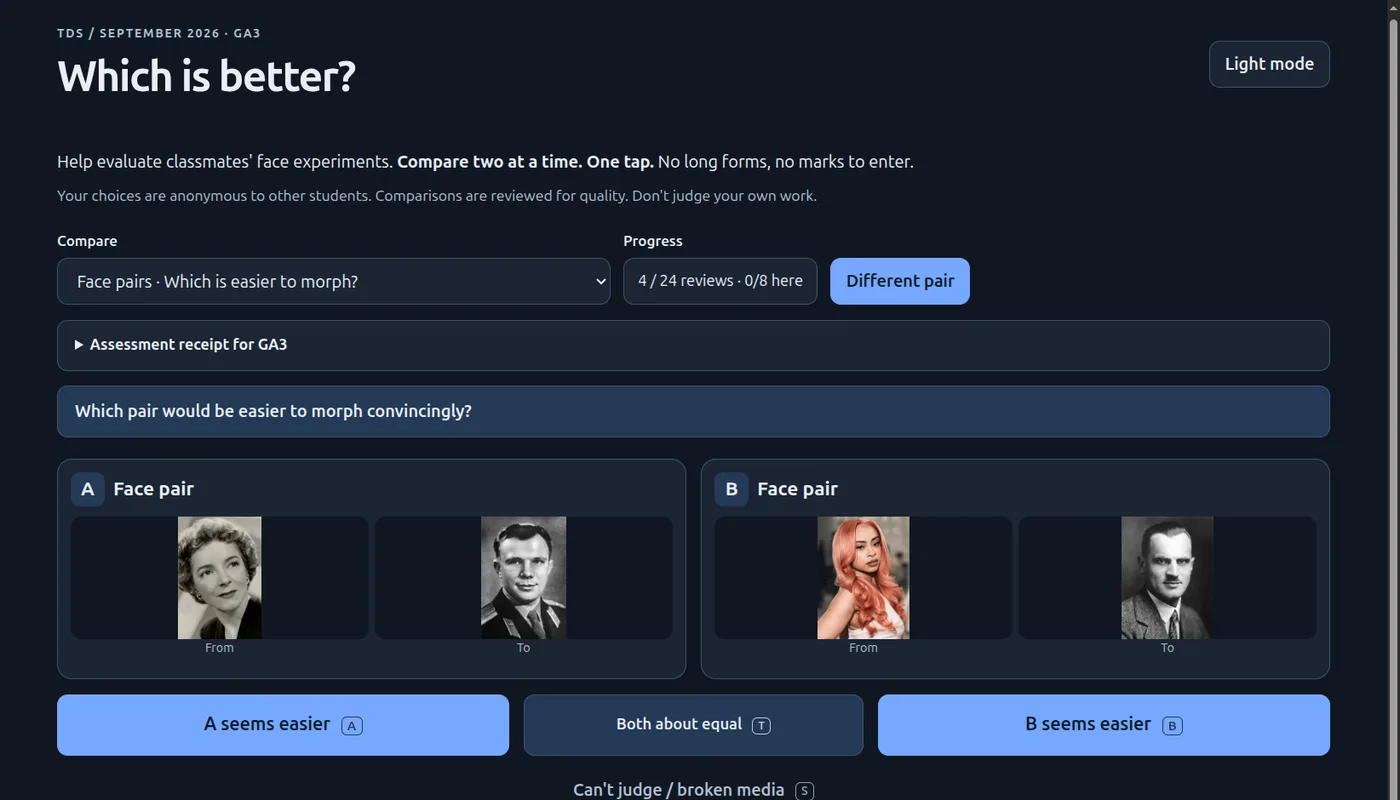
To show why, he pulled up bad design that I implemented in one of my exams just a short while ago intentionally. 62:09 TDS students had to morph one face into another. The same exam also asked them to rank ten face pairs by how easy each would be to morph. Ten things at once is hard. A 1-to-10 score for each would have been even worse. A ranking at least lets you reason locally: man to man, that’s slightly easier. Black and white man to color woman, that’s pretty hard. 62:47 But it still takes a long time.

Then he showed the alternative: the same work, two at a time.

Face Review · TDS GA3 · “Compare two at a time. One tap.”

Three questions, each asked as A or B

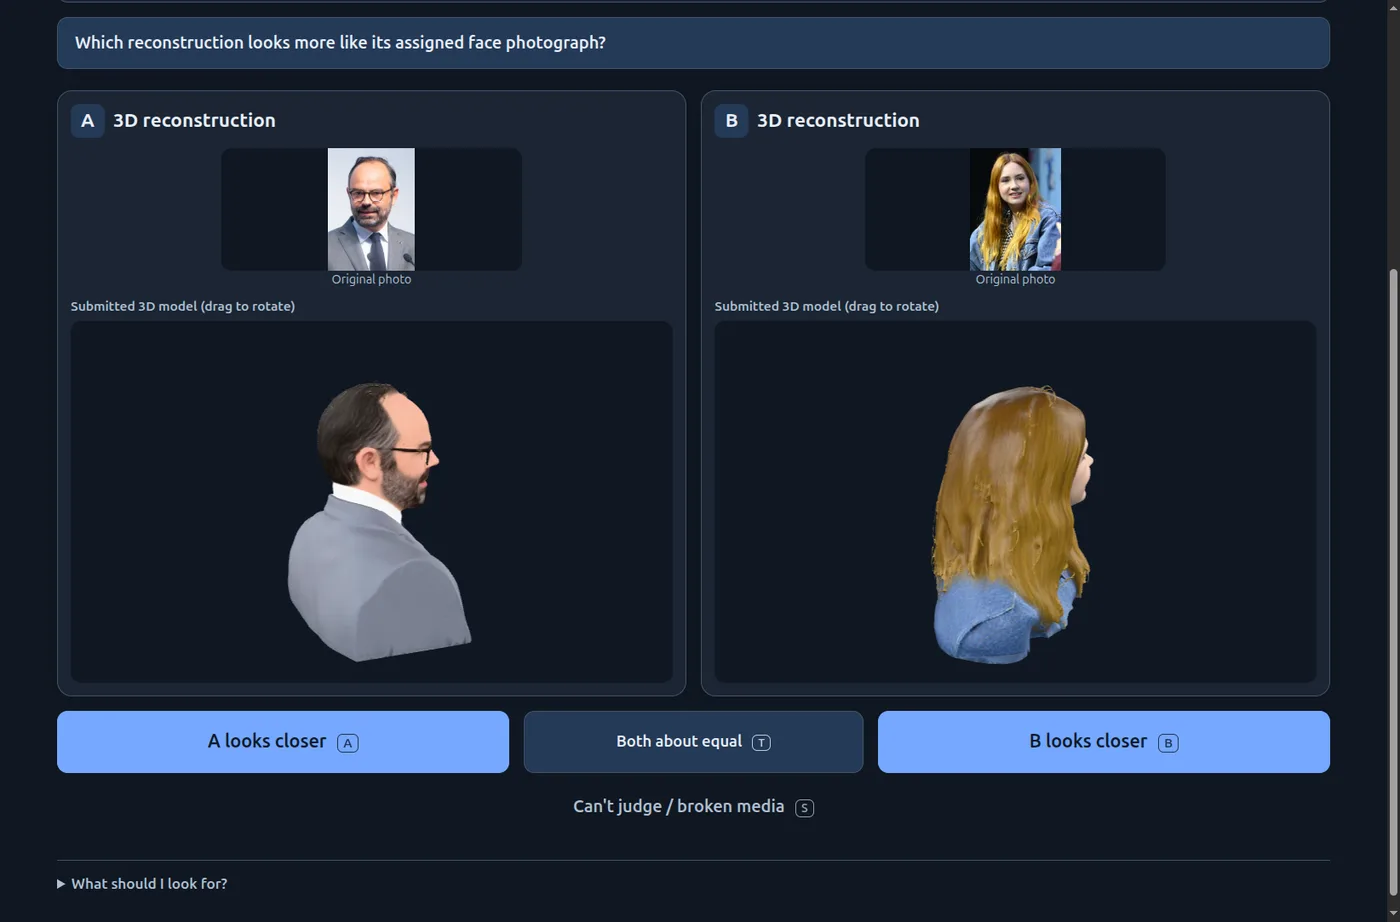
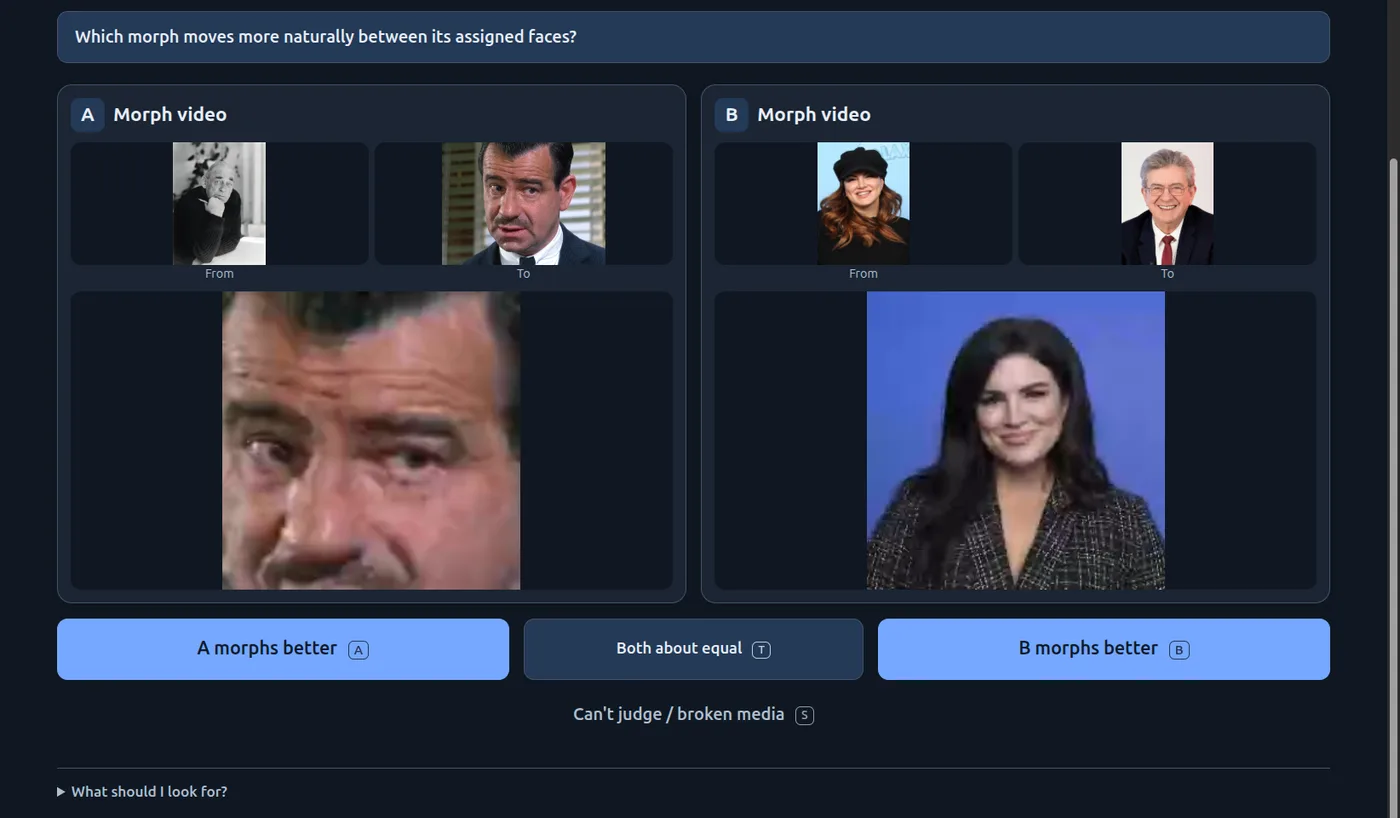
Students review classmates’ face experiments on the Face Review page (it requires a course login, so these are screenshots). Every screen asks one question with three buttons: A, B, or “Both about equal.”

Face Review page asking 'Which reconstruction looks more like its assigned face photograph?' Two student-made rotating 3D head models, each beside its reference photo, with buttons A looks closer, Both about equal, B looks closer.
3D faces. Which model looks more like its own photo? The models rotate as you watch.
Face Review page asking 'Which morph moves more naturally between its assigned faces?' Two morph videos with from and to photos, and buttons A morphs better, Both about equal, B morphs better.
Morph videos. Which morph moves more naturally between its assigned faces?
Face Review page titled 'Which is better?' asking 'Which pair would be easier to morph convincingly?' Two from–to photo pairs with buttons A seems easier, Both about equal, B seems easier.
Face pairs. The ten-way ranking from the exam, redone as a single A-or-B choice.

He ran it live. On the first pair of 3D faces: A looks closer. On the second, the room split. Now we’re divided, right? How many people say A? How many people say B? 64:00 The split itself was informative:

“Some people say what matters is alignment to the facial features … What others say is, ‘Look, a 3D visualization has got to be a 3D visualization, not a face plastered on top of a sphere.’ Both are valid perspectives. But it’s important to know.”

— Anand 64:12

The other effect showed up at once: speed creates momentum. When I started playing this, I couldn’t stop. I’m saying “playing,” this is actually an exam question. 64:58

“What you want people to do is give them a clear, simple task, and they will do it for a long time … So, if you can gamify the whole thing, nothing like it. Then you will get plenty of feedback.”

— Anand 65:21

This answers the manager problem from earlier. Busy people won’t sit through your 20-minute walkthrough. They will tap A or B on their phone a dozen times. You also lose little information. Statisticians have known for a century that many simple pairwise judgments add up to a reliable ranking. That is Thurstone’s law of comparative judgment and the Bradley–Terry model, the same maths that sits behind chess ratings and LLM leaderboards. For your next chart, don’t ask for “feedback”. Show version A and version B, and ask which one helps them decide.

Act V · Same test, new formats

Six hundred students, one WhatsApp group

With twelve minutes left, Anand asked how many people had built a mobile app for the first time for this course’s homework. About half the class. Almost nobody had drawn a chart for the first time in this course; they did that in school. That gap is the point: the number of formats with which you can communicate data is exploding. 67:05

The 3D faces they had just judged came from a TDS exam question worth half a percent. If anybody had spent more than 15 minutes doing that, they would have been wasting their time. The students knew it, and they were organised:

“All 600 of them created a WhatsApp group, just posted, ‘Has anybody solved this problem? Which tool does it right?’”

— Anand, on TDS students and the 3D-face question 67:42

The group settled quickly on Meshy: a decent free tier, a better paid tier for a few dollars. And yet: the sad part is, even with this knowledge, even with this group, you saw the kinds of visualizations people were trying to create and submit. 68:01

“It is one thing that it’s possible to create something well, the technology exists. It’s another thing to know it. It’s another thing to use it. So, there is a long tail.”

— Anand 68:01

A phone is one of these new formats, with a twist. In their assignment the students weren’t displaying data on the phone. They were collecting it, using the accelerometer, gyroscope, microphone, camera and GPS (through browser APIs like DeviceOrientationEvent and the Web Audio API): You were actually using it as a sensor, as a data collection source. 68:20 A sensor app gets tested twice: is the reading true, and does the app work for the person holding the phone? It’s the same pair of tests as for a chart.

Act V · Same test, new formats

“Help me help you”

Anand would grade the apps, and the students were about to review each other’s. So he asked them to set the standard first: I want you to help me help you. 68:55

Question 6 · two minutes, alone

You have built a mobile app that works on your own phone. How would you test whether it works correctly and is useful to someone else?

What would you try, what would you observe or measure, and what would count as a failure?

This time the answers were stronger. Weeks of building had given the students concrete failure modes to think about. Hand-coding the 24 answers:

How students would test their own appof 24
Watch a new or target user try it, or ask if it’s useful12
Try other phones, screen sizes or browsers8
Compare readings with a known reference or ground truth7
Deliberately push it into edge cases or failure6
Give a number for how accurate is accurate enough0
Hand-coded, non-exclusive. As with charts, most answers covered either the instrument or the user, and no one gave a numerical pass mark.

Some of the answers were excellent checklists:

“Test on different phones / Try no internet, low battery / Deny permissions, rotate screen / Watch a new user try it / Fail- crashes, wrong readings,confusion”
Failure-first testing in five lines
“If i try something and the developer didnt mention anywhere that i shouldnt do that/warn me about that specific case., then its a failure...”
A user’s definition of a bug
“I would measure with know data whether the app predicts the same data or not, giving false positives is a failure. For my floor level checker app it is whether it detects the floor as levelled or bumpy when tested.”
Ground truth, plus a named failure
“A test is considered a failure if the user is confused and asks what to do, or if the application crashes, freezes during interruptions, or lacks the utility to be used more than once.”
Failure covers usefulness, not just crashes

One student made the opposite case: the app should be reliable on at least single phone at a time. Not necessarily robust as time might be a constraint for a full scalable project. That is a fair position, if you say so up front. A one-phone prototype that is honest about being a prototype passes. The same app sold as “works for everyone” fails. The test depends on the promise.

The same gap showed up as with charts: phrases like close approximation, consistent results and work as intended sound like criteria, but they can’t fail. Here is how to make each vague check falsifiable:

Vague“if the walking distance or step count is close approximation or not?”Make it testable ▾

TestableWalk 100 hand-counted steps, three times, on two phones. Pass if every run reads 95–105, and standing still for a minute adds zero.

Vague“compare the app speedometer reading with the actual speed the person might be going in.”Make it testable ▾

TestableHold a steady 40 km/h by a reference (car GPS or a calibrated speedometer) for 30 seconds, three runs. Pass if the app’s mean is within ±3 km/h.

Vague“if it is simple enough for ppl to understand without a tutorial”Make it testable ▾

TestableGive it to five people who have never seen it, with one task (“Is this table level?”) and no help. Pass if at least four answer correctly within a minute without asking anything.

Vague“UI is working proportionately across all devices and not just my phone”Make it testable ▾

TestableRun the same three tasks on an old Android, a new Android and an iPhone, in two browsers. Pass if all of them load, ask for sensor permission and finish, and their readings agree within your stated tolerance.

The numbers are illustrations, not standards. Choosing and defending your own threshold is the actual skill. Turn each failure you find into a regression test, so it can’t come back unnoticed.

Act V · Same test, new formats

Swap phones

The last ten minutes were the experiment itself. The instructions:

“Submit a voice recording in which you read out saying, firstly, whose app you tested … what it does … what you tried, what works well, and one thing to improve.”

— Anand 73:32

One rule mattered most: Before you ask them what the app does, try it out once. 73:55 That is the cold read from Act I, applied to apps. The room got noisy. My app requires a mic. Can we clap? asked one student. Yeah, go ahead. Make all the noise you want. 75:31 About twenty voice reviews came in, transcribed by Gemini after class. Here is a sample of what classmates had built and what their testers found:

SetupScope

Guitar tuner and setup tool using the mic. Detects each string, and checks intonation at the 12th fret.

Worked: “it gives specific instructions, like ‘move the saddle back 1.5 mm’, instead of just saying something is out of tune.”

Improve: accuracy “when multiple strings are ringing”; save results over time.

NoiseLens

Live noise levels, a day-by-day split, and how much of it is speech.

Worked: a “sensor trust level”, i.e. how far the readings can be trusted.

Improve: “a live spectrogram is given there, which seems too complex for someone like me to understand, so it won’t help naive audience.”

Belt-tension checker

Flick a factory belt; the phone hears its frequency and says tighten or loosen.

Worked: “it works pretty well”; much easier than strumming and guessing.

Improve: “I only figured it out once he explained it to me on his own verbally.”

Room-echo tester

Record three claps; it plots how fast the sound decays and suggests whether the room needs cushioning (reverberation).

Worked: the clap test ran and showed the decay.

Improve: “the UI is good, but it is not telling what the app is exactly doing.”

Light meter

Measures light intensity around a room using the camera and screen.

Worked: readings changed as the tester moved about. Noticed: “When I keep my hand on nothing, it doesn’t show zero, but it shows some noise like 2 to 3, 5.”

Improve: a map of light across the room instead of a daily min/max.

Solar-panel setup

Tilt angle vs. the ideal for your city, plus shade, combined into expected energy.

Worked: four clear tabs: setup, tilt, shade, results.

Improve: “there could have been a better visualization graph.”

Study-spot finder

Logs noise and how often you got distracted, so you can compare places to study.

Worked: “nice visualizations are created where you can compare different locations”.

Improve: “it’s usually probably just a one-time thing that I would do.”

Motion IQ

Detects walking, hiking, cycling, bus or car; tracks location; exports CSV.

Worked: long-term activity tracking and data export.

Improve: “the visualization part of the app could have been better.”

RoadSense

Checks hand tremor before you drive, then tracks speed and harsh moves.

Worked: “in the classroom where I could test it, it’s working fine”.

Improve: “We haven’t tested it with the actual scenario.”

Also tested: a neck-posture monitor, a scroll counter, a best-seat-in-class acoustics map, a road-quality driving score, a sound-by-location logger, a vibration meter, and several tilt recorders. One had a set-zero button, another magnified tiny tilts onto a compass. Reviews quoted from the Gemini transcripts; names omitted.
Read twenty reviews in a row and the lessons of the whole class come back:

The form ran on Anand’s laptop, so it would go offline when he left. Anyone who’s completed it, feel free to head out. 81:01

Takeaways · six habits to practise

Before you call any chart, or any app, done

01

Commit before you discuss

Write your answer down first. The gap between your first and second answers is what you learned. Without the first, you can’t see the gap.

02

Run two tests, not one

Is it true? Recompute from raw data and check the shapes match the numbers. Does it work? Give real readers a task. Only 5 of 24 students proposed both.

03

Agreement isn’t proof

Everyone can agree on something false, especially if they all share your blind spots. Ask how a reasonable person could misread it, the way an editor would.

04

AI sees differently

Use it to recalculate, propose alternatives and invent failure cases. Don’t use it as a stand-in for your audience. It saw the owl no human could, and missed the donkey every human saw.

05

Ask busy people “A or B?”

One tap is cheap, fast and fun. Disagreement shows you what different readers value. Make feedback a game and people will keep giving it.

06

Write the failure condition first

Decide the number that would make you reject the work before you test it. No student wrote one, for charts or apps. That is the next skill to build.

Transcript

Open full size ↗