1
The finder
“I can’t solve it, I don’t know how to solve it, and I don’t know how to find people.” The agent can solve it. Finding the people is the skill: join a community, or form one.
What the grader sees: a correct submission
IIT Madras · Tools in Data Science · Monday 16 Nov 2026
A student turned one of the hardest timed questions in the course into a single HTML file that runs without any AI model. In the same hour, three other scores turned out to be measuring something their designers hadn’t quite intended. This is the meeting where the students’ experiments made the teachers revise what counts as learning.
The story reads on its own. Every 42:23 plays that moment of the meeting in the video panel, which stays put while you read; Focus video enlarges the same player without losing your place. Claims carry a label for where they come from:
Act I · The file
41:10 – 47:28Said
About forty minutes into the meeting, Anand was explaining why one question in the course’s first project had defeated the machines. Invisible Ink asks students to draw letters in the air with their phones. The exam records only the phone’s motion, a stream of numbers in a JSONL file, and students must work out which letters were written. It is timed, and the letters are wobbly. A person squinting at a plot of the motion can often guess the letter. The frontier models, he said, could not. 40:28
“I don’t know why a model is not able to do that with its rather stunning vision capabilities,” he said. Then a student unmuted.
Claude Fable 5.2 had been released one week earlier, on 9 November. Adwitiya had used a limited-time promotional offer to point the newest frontier model at the problem, and had it build something that no longer needed the frontier model: a page you download, open in a browser, and give your motion file. He had even, he explained a few minutes later, “eliminated that dependency for Python on the end-user’s machine.” 45:12
That is a different achievement from “the AI solved the exam.” It is closer to what an engineer does when a prototype becomes a product. The expensive intelligence went into making the tool. Using it costs nothing.
The solver’s life cycle as Adwitiya described it. The last step is the one nobody has done yet.
Anand downloaded the page from the student group, shared his screen, and gave it one of his own motion files. 44:08 The decoder began laying out letters. And here the scene turns into something every data scientist will recognise: two humans peering at a machine’s output, unsure whether it is right, with no answer key in front of them.
“Based on a visual inspection, I think, for instance, out here, the F seems to be reasonable, but this E is a bit of a stretch. … V might be a stretch as well. H is definitely a stretch. Y is possible.”
JK, looking at the same screen, offered “P, C, D” for the left side, and then: “E, I’m not sure.” 46:10 Adwitiya had said as much at the start: he couldn’t be certain because he didn’t have the answers either. What the meeting saw was a working, portable tool, not a measured one. “We’ll have to see how well it actually is doing against the results,” Anand said.
There was a second solver. Adwitiya pasted a link to a public GitHub repository by another student, Shrikar. Anand opened it, saw it needed installing, and said, reasonably, that it was “going to be more work than I’ll do in this session.” 46:24 Nobody ran it.
“If both of these are deterministic … and any others are able to solve this in a way that does not require tokens, that’s saying something. That’s saying something.”
Anand 46:52
His next sentence was about his own job. If students can use a frontier model to manufacture a free, shareable solver within a week of its release, then the exam designer has to “go start looking for problems that are at the cusp of what is possible, not so hard that no one can do it, not so easy that everyone can do it.” 47:16
The question he had called hard for agents had become a question one student had already packaged for the rest. The test hadn’t been broken. It had been moved.
47:28 – 50:58Said
JK went straight to the consequence. The student group where the solver was pinned is not just this term’s cohort; it is “a historic group which has seen a lot of people from across the terms joining in.” How many of them used the solver? Did scores rise around it? 47:28 Could the course see a network effect? And, he suggested, why not let students cite where a solution came from? 48:40
Anand noted that the citation already happens by accident: when one URL gets copy-pasted around, the first submission of it is effectively the source. Then he laid out what may be the most useful idea of the meeting: the same shared file produces three different kinds of learning, depending on who you are. 49:12
“I can’t solve it, I don’t know how to solve it, and I don’t know how to find people.” The agent can solve it. Finding the people is the skill: join a community, or form one.
What the grader sees: a correct submission
“Somebody solves it for me, I take it and use it. Do I still learn something?” Anand: “absolutely.” You learn the problem is solvable, and how, and you can point to it next year.
What the grader sees: a correct submission
A few people will create many of these solvers; for them it may be a career path. But “not applicable for everyone, it’s probably a bad idea for everyone.”
What the grader sees: a correct submission
“90% of what we really need is an exposure to, ‘Here is a kind of problem, it is solvable this way, rest the agent can take care.’ … The vast majority of people need to learn how they can apply what people have created, not how they can themselves create.”
This is a hypothesis about learning, offered in conversation, not a measured result. But it exposes a measurement problem that is real and immediate. The builder, the user and the finder all upload the same answer. The exam’s score cannot tell them apart. One learned design, one learned that the problem is tractable, one learned whom to ask. A fourth may have learned only how to paste.
That riddle, what is this number actually measuring?, turns out to be the thread that ran through the whole meeting. The solver arrived late in the hour. Before it, the faculty had spent forty minutes looking at three other scores that each, in its own way, had measured something other than what its designers meant.
Act II · Three scores that measured something else
00:26 – 07:41SaidData
The meeting had opened with a small experiment. Over the weekend Anand had run a data-science workshop for experienced professionals and given them exactly the assignment TDS students had played the week before: Food Court. Four or five players each run a stall in the same food court for a simulated year. Every month each stall offers a 0%, 10% or 20% discount. Discounts pull customers in and shave margins, and they pull customers away from your neighbours. Marks are 60% the whole court’s profit and 40% your own, so the game rewards restraint and punishes price wars. Players have twenty minutes and a chat box. 00:26
Before showing the numbers, Anand asked JK to guess. JK expected the professionals to cooperate less than students who had spent weeks together and had marks at stake, but to bring better strategy and better powers of persuasion: “at least to management they should have, right?” 01:29
JK was right about cooperation and wrong about strategy. “They were even more clueless than the students,” Anand said. About half the workshop’s final monthly choices were 20% discounts, the move that, in this model, “completely kills the population.” In the TDS sittings it was a quarter or less. Some of the professionals objected that they didn’t know how to run a food court. “Well, it’s not as if students know how to run any business.” 05:44 06:24
But the strangest finding was about JK’s third guess, persuasion. The game records each room’s position at fixed checkpoints. As the workshop rooms talked, their scores went down.
“On the margin, it would have been better for them to stay silent rather than speak.”
The workshop teams weren’t idle. They saved more plans per room than the students did and sent about half as many messages. In one room a player kept arguing against year-round 20% discounts while a neighbouring stall’s final plan offered 20% in every one of the twelve months. They were experimenting individually and not converging together. “Maybe they are better at speaking than typing,” Anand offered. “I’m not sure.” 07:36
“we had to scroll down for chatting & scroll up for adjusting the discounts … a floating chat window would have been better I think”
That chat message is worth more than it looks. If the controls and the conversation can’t be on screen together, the game is partly measuring who tolerates the interface, and a group meeting it for the first time pays most. Workshop players also asked where the Save button was and whether all the stalls were one team.
07:56 – 12:37SaidLater
The second score was the one the faculty had just finished computing. In the third graded assignment students had built a 3D model of a face and a face-morph video, and then judged each other’s work in pairs: which of these two is better? Thousands of such votes came in. The question was how to turn them into marks. 07:56
JK asked first about sample sizes: were the numbers of submissions comparable across questions? Roughly, in the 600–700 range, Anand said, except the ranking question, which drew more entries because it only asked for an opinion. 09:19 Then he explained the method with a real case.
“The student got 13 wins out of 26. … But in the latter case, the 13 that they won were tougher opposition.”
The method is the Bradley–Terry model, from 1952, the same family of ideas behind chess ratings. Each entry gets a hidden strength; the chance that one beats another depends on the gap between them; the model finds the strengths that best explain every vote at once. Anand compared it, loosely, to Google’s PageRank. A win against a strong opponent is worth more than a win against a weak one. The scores were then stretched so the weakest eligible entry gets zero bonus and the strongest gets the full 7.5. 11:51
That sounds like a technicality. It isn’t. Choosing raw win rate, a percentile, a reliability-shrunk score or Bradley–Terry moves real marks between real students, and the faculty compared all four on edge cases before choosing. The model also assumes things that peer votes don’t guarantee: that quality runs along one dimension, that A beating B and B beating C makes A likely to beat C, that the comparisons connect everyone.
The third question asked students to predict which face pairs would be easiest to morph, originally to be checked against how the morphs actually turned out. Not enough pairs had been morphed and rated to do that, so the faculty approved a proxy: how hard other students judged each pair to be. Related, not identical. Separately, 136 entries with no usable comparisons (unreachable or broken media) were given zero. Scoring used 24,052 peer votes. Later At the time of that analysis, the marks had been sent to the course team for review; the live gradebook had not been changed.
19:01 – 29:07SaidPublic data
The third score came from a creative task. Each student made a wordless picture story, usually with an image model, and then read and ranked classmates’ stories. Every story got three numbers: uniqueness (how different it was from every other story), understanding (whether readers could retell it) and preference (whether readers liked it more than the others). Anand had written up the results in a blog post on 7 November and now walked JK through the public results gallery. 19:01
The least unique stories clustered around a handful of templates: the thirsty crow and the pitcher, a child adopting a dog, an old man rescuing a child’s kite, a robot watering a plant. “Frame for frame, same story,” Anand said. And the class loved them. 23:34
“Hey, this is why mass cinemas work, Anand.”
At the other end sat the strange ones: a woman who receives a gift she doesn’t want and says “Thanks, I love it”; an astronaut who steps onto the moon and answers a phone. Very unique. “But all three had surprisingly low preference rating.” 25:20 Within this class, uniqueness and preference pulled in opposite directions. Anand’s blog is candid about the reason: “I’m not sure why.”
There were exceptions, and they matter. The highest-scoring story of all was a Bhagavad Gita panel: Arjuna troubled in his chariot, Krishna’s cosmic form. Fairly unique and much liked. The second was a satire of a rich man bribing a policeman while a beggar child is shooed away, then a politician showering a crowd with cash; JK was surprised “satire scored so high in the understanding and popularity,” since satire is so hard to get across a border. 21:57 28:16 Original and loved is possible. It is just rarer, and harder.
JK wondered whether the template-story students had shared prompts with each other. Looking at a cartoon version of the dog story that had done worse, they wondered whether people prefer realistic images to cartoons. “I should test that hypothesis,” Anand said. 26:39 Nobody has. The negative correlation is one cohort, one task, one embedding model’s idea of “unique”; it isn’t evidence that audiences dislike originality in general.
The rubric here was deliberately built from all three numbers, because the course wants students to practise three things AI makes newly important: creating something distinct, communicating it clearly, and reaching an audience. The data says those are different skills that can trade off against each other. A single total hides that. A student who wrote the fortieth crow story and a student who wrote the only Gita story can land close together for opposite reasons.
Earlier, JK had asked whether generative media would wipe out conventional content agencies. Anand’s answer came with a client story 14:48: a large company that pays an agency handsomely to localise the same ad for festival after festival, country after country. His team showed a proof of concept that AI could do it. Would the client now let its own team take over? No.
“Supposing there is a copyright claim, some copyright-related issue, or some cultural sensitivity … My team does it, I don’t have any of this infrastructure in place. I need an external neck to catch. But I can use this to show them and negotiate the price.”
Being able to generate the output is not the same as being willing to own its risk. In the chat, Swarnam pointed out that AI-created content has liability issues and court cases. 18:20 Anand replied that large providers now indemnify enterprise customers. That is true but narrow: Google’s generated-output indemnity covers listed services and unmodified output, with exceptions. It isn’t a warranty against cultural missteps or a client contract that says “no AI.” Anand made the same point himself: some businesses have promised their clients exactly that, “a shrinking number.” 20:36
29:07 – 35:46SaidLater
The fourth score was a forecast. Students had to predict how much the course’s shared AI gateway, AI Pipe, would spend in one week, 2–8 November, by choosing a range and updating it as the days went by. The actual spend was $5.31, which put the winning range at $5–$10. 29:07
The transcript prints Anand saying “242”; the recording’s captions and the ledger analysis he was reading from both say 262. 29:36
Some of the best reasoning came from students who stopped extrapolating and started using constraints. One wrote, in effect: we’ve already spent $5.24; to cross $10 by tomorrow we’d need another $4.76; is that even possible? 30:04 Another had ridden October’s spike from $5–$10 up to $100–$200 and then backed down, day by day, as the spending refused to cooperate.
Then Anand said the thing that makes this a story about measurement rather than forecasting.
“Students with better information, actually, sometimes got worse marks.”
The rubric rewarded forecasting early and holding a position, not just being right at the end. That was a deliberate choice; it pays for participation discipline as well as judgment. But it means a student who joined late with sharper evidence could finish below one who guessed early and sat tight.
And then there were the clicks. Some students worked out “$5 to $10” correctly in their written reasoning and selected 5 to 10 cents in the interface.
“Good reasoning, poor execution.”
JK had seen this across courses: students who apply the right model and land off by a factor of ten or a hundred, even when a calculator is allowed. 31:25 Anand answered with a confession. He can’t remember faces; he swaps digits; his short-term memory for process is poor, so he became an obsessive note-taker early in life. 32:32 Everyone has blind spots. What matters is noticing which ones are consequential, deciding whether to fix them, and having the discipline to do it. The score can do the first job: it tells you that you stumbled. The other two are the student’s.
“Patterns you expect often end up overshadowing the patterns that exist in your memory”
This is also why he describes the course as a menu rather than a syllabus: “There are 100 things one can learn from any arbitrary exam or course.” A student who already knows A, B and C should leave having learned E, F and G. 33:50 The cents mistake might be the one thing a particular student needed to learn, or it might not matter to them at all. An agent told to fill in the form, he added, is less likely to make it.
Four scores, four surprises. Each measured what its design rewarded, which wasn’t always what its designers believed they were measuring.
Food Court rewarded coordination under a clumsy interface. Peer grading rewarded beating strong opponents. Picture stories rewarded the familiar as much as the original. The forecast rewarded starting early. And the Invisible Ink score can’t tell the student who built the solver from the one who pasted it.
Act III · The next exam
50:58 – 59:04SaidProposed
With the solver on the table, JK reminded everyone that Anand had promised a very different ROE. Anand described what he was imagining. Not a list of questions, but a game: a world of rooms that players walk through, bumping into each other, negotiating, buying, selling, solving problems sometimes together, sometimes alone. 51:15
There would be no question numbers. “Now it’s, ‘Okay, I’m in this room where there is a chest or whatever, and I opened the chest, and I found the problem.’ Except the same problem might appear for somebody else” somewhere else, at a different time. 52:00 And crucially, each student would have one character.
“You will not easily be able to run multiple agents in parallel because you have only one character. … At any point, you can be in only one place, and is that where you want to be?”
A sketch of the kind of choice Anand described, with made-up rooms and marks. The point is the trade-off, not the numbers.
That turns the exam into a question about prioritisation, for you and for your agents. “If you put your agents at the game, you have to be very careful about figuring out what prioritization you want to give your agents.” 52:40 Do you skip, persist, or look for a solver someone else built “while you are hopefully sitting dazed in the middle of the exam, trying to steer the agent?” 53:28 He floated “call a friend” trade-offs: “do you want five minutes extra versus do you want one mark? Do you want to be able to swap questions?” He wasn’t sure whether a human or an agent would choose better, but suspected an agent fed with the class’s WhatsApp and Google Chat conversations, and steered by a human who could keep up, might do best. 58:08 58:44
Read against the first half of the meeting, the design is a direct response to the solver. If any single well-posed task can be packaged and shared, the scarce skills become the ones a file can’t carry: choosing what to work on, finding who has already solved it, judging whether their tool is right, and coordinating with strangers under time pressure.
53:48 – 57:53Said
Adwitiya raised his hand with a design suggestion. The live games are anonymous. In his own sessions, he said, some teammates didn’t try very hard, perhaps thinking, “I have one more session. Why waste my attempt here if my score has already gone down?” That hurt the whole team. What if players saw each other’s real names? People are moved by personal gain and by how their peers see them; anonymity switches off the second. 53:48
Anand agreed it would be an interesting experiment, and that the course may already have data to test it. But anonymity, he explained, had been the point.
“Can you make sure that that fourth person, even though anonymous, is someone you can bring back into the game? What does it take to be able to do that?”
A class that wanted to could, within a day, build the social infrastructure to find a disengaged teammate: a shared register of everyone taking the course, a rule that players post their game handle before each session, or a group of four agreeing to play together at an unusual hour. 56:00 His estimate of how many managed something like that: “closer to less than 10%.” 55:52
One who did was in the meeting. Preethi typed that for the Time Use Charts game her team had simply opened a Google Meet alongside it, “for a clearer transfer of instructions & data,” since nothing in the rules said they couldn’t. 55:02 JK relayed it; Anand: “Exactly the kind of thing that is required. So a good ROE will require a higher level of collaboration.” 57:36
Real names add accountability and remove privacy; they can also bring in pressure, harassment and status effects that anonymity keeps out. Coordinating outside the game is resourceful, and it also creates channels the course can’t see or review. The course allows agents and collaboration in many tasks. That isn’t licence for impersonation or getting into what you weren’t given. Neither design is obviously right; both are now explicit experiments.
59:04 – 65:00Said
Near the end Preethi asked, in chat, about a question in the fourth graded assignment that asked students to invent an ROE question: why could it cost a mark? 60:17 The answer revealed one more gap between what a score is and how it feels.
Partly, Anand said, it is just psychology: +10 or −1 is the same spread as +11 or 0. 60:36 Partly it was to stop people telling an agent to submit something without reading it, because he reads these himself. And most of what came in was poor, not because an agent wrote it, but because “the critique of the agent has been really poor.” Of the submissions, only about 65 were worth reading, and roughly one in ten of those looked like earning positive marks. 61:04
“It’s just minus one on a GA. It’s a tiny component of a tiny component, and the amount of emotional impact that it has …”
“Sir, in TDS we treat every mark gained as a gift given to us by the cosmos :)”
JK explained how bonus marks are normalised by an assignment’s weight, capped at +5 for the course (rarely +10) and at 100 overall. 62:20 Anand told a story from class seven: a history teacher set a 100-mark quiz with a 30-mark question, and the class panicked about writing forty pages, though 30 out of 100 is just 3 out of 10. 63:24 Next time, he joked, he’d make the ROE worth one mark so every penalty is 0.1.
Both sides are right. As a fraction of the final grade, −1 is tiny. As an experience, a loss is louder than a gain of the same size, and a student who has been told “every mark matters” will feel it. The course’s intended lesson, read what your agent wrote before you submit it, is a good one. Whether students learned it, or learned to fear the question, is exactly the kind of thing a score won’t say.
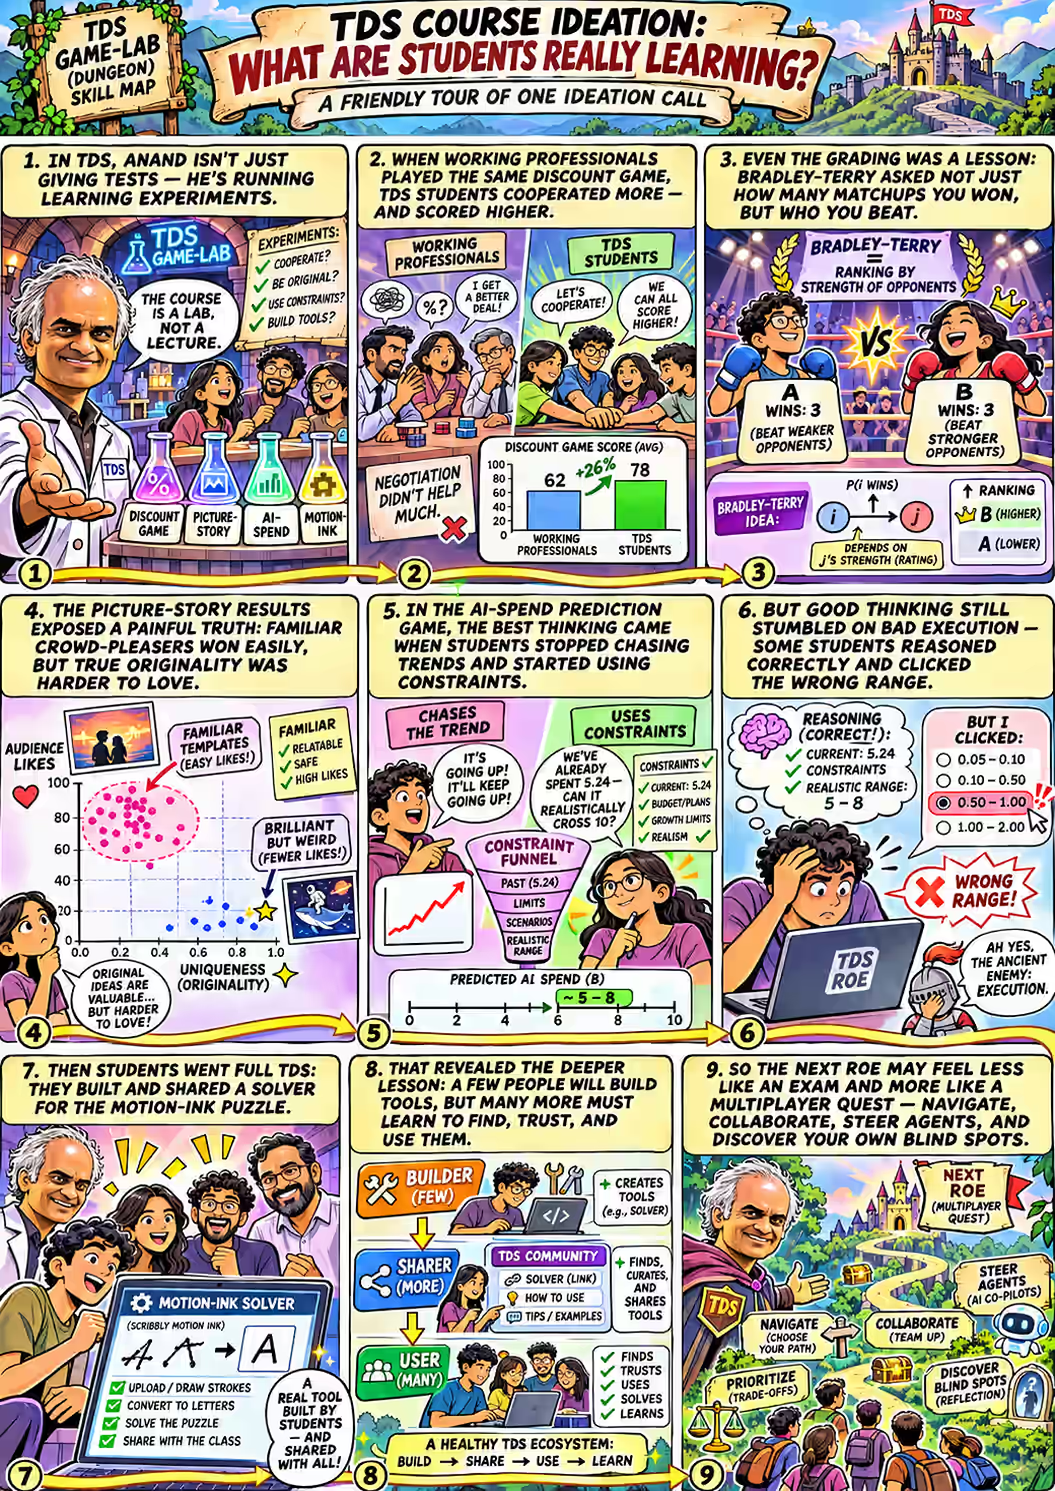
A visual summaryAI-generated
An AI-generated comic was made from this meeting. It captures the mood well. In a story about scores that measure the wrong thing, it seemed only fair to score the comic. Red rings mark what it got wrong; hover or tap a ring for the real number, or switch to the original to see the art untouched.
What to take away
Use the frontier model once, to manufacture a deterministic tool everyone can run for free. Then test it against labels before you trust it. 42:23
The finder, the user and the builder submit the same answer. If you care which one learned what, ask for provenance, then a new task the file can’t do. 49:12
More plans and more debate lowered the workshop’s score. Agreement that doesn’t become shared action is just noise, and an awkward interface makes it worse. 07:08
Equal win counts can hide unequal opponents. Bradley–Terry fixes that, but only by assuming quality is one-dimensional; check the assumption. 10:55
Audiences reward recognisable templates. Originality needs its own instrument; a popularity score will quietly punish it. 23:38
Right reasoning plus the wrong click is a wrong answer. Verify what the system recorded, not what you meant to submit. 31:12
The students tested the teachers’ games, and one of them changed what the teachers thought was hard. A course that teaches verification now has to verify its own scores, and find out whether finding, using and building actually transfer.
[00:00] marker at about 49:58 and prints “242” where the captions have “262”; the story follows the captions.